Histograms are on the upper pad and graphs are on the bottom pad.
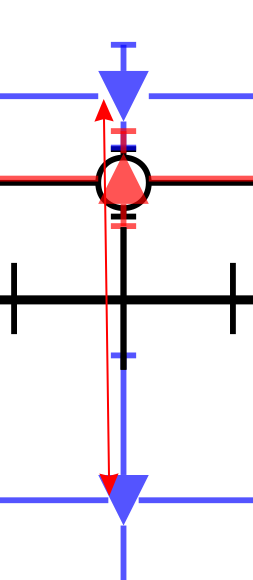
Note the spacing between the marker and error bars.
I do not have the answer …
Can you provide a small macro showing this effect ?
I don’t think so ![]()
Only a canvas saved as .C-file…
Ok send it, I can have a look.
Here is the macro without dependencies
draw.C (1.6 KB)
Thanks.
I this this tiny effect… I have to investigate to understand from where it comes.
Yes the two markers and errors bars are not painted by the same code.
But the difference is really tiny.
Does it really create you some serious problem ?
No, but this does not look perfect.
May be you can create a Jira report with this in order to not lost it.