When we can create a Tgraph with Tree

Hello,
I don’t understand why my program didn’t function.
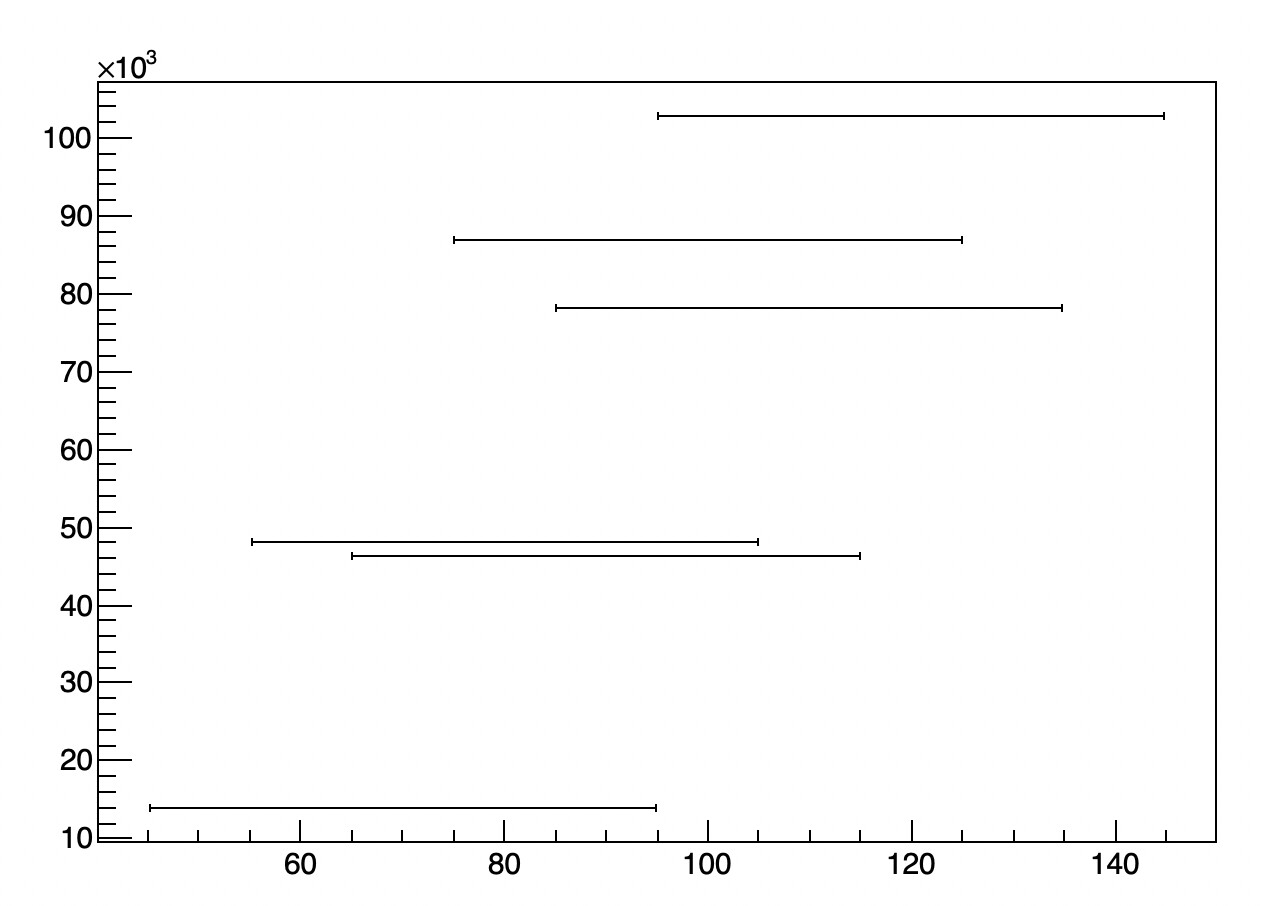
It is possible to create a graphe with TGraphe with Tree data ?

void OMline()
{
  gStyle->SetOptStat(0);
  gStyle->SetOptFit(1111);
  //gStyle->SetMarkerSize(3);

TCanvas *c1 = new TCanvas("c1","",0,10,0,500000);

TFile *input = new TFile("/home/kdupuy/Documents/fichier_root/valeurspics2.root","READ");

TTree *tree = (TTree*)input->Get("valeurspics2_tree;1");

double Constant1, Mean1, Sigma1, om_number1;
int pics, intensity;
Double_t error1, error2, error3;
Double_t x[6], y[6],ex[6],ey[6];
Int_t n = 6;

tree->SetBranchAddress("om_number1", &om_number1);
tree->SetBranchAddress("Constant1", &Constant1);
tree->SetBranchAddress("Mean1", &Mean1);
tree->SetBranchAddress("Sigma1", &Sigma1);
tree->SetBranchAddress("pics", &pics);
tree->SetBranchAddress("intensity", &intensity);
tree->SetBranchAddress("error1", &error1);
tree->SetBranchAddress("error2", &error2);
tree->SetBranchAddress("error3", &error3);

int entries = tree->GetEntries();

for (int j = 301; j <= 301; j++ )

{
  //TH2D *hist7 = new TH2D("hist7", "",1000, 60, 130, 1000, 0, 500000);

  TF1 *fit7 = new TF1("fit7", "pol1", 0, 400000);

  TGraph* gr = new TGraphErrors(n,x,y,ex,ey);


for(int i=0; i < entries; i++)  // rentre les valeurs de la branche dans notre variable

    {
      tree->GetEntry(i);

      if (om_number1 == j)
      {
      //cout << Mean1 << pics <<  endl;
      //hist7->Fill(intensity,Mean1);
      for (Int_t i=0;i<n;i++)
      {
        cout << intensity << endl;
        x[i] = intensity;
        y[i] = Mean1;
        ex[i] = error2;
        ey[i] = 0;
      }
      }
    }

  //TGraph* gr = new TGraph(n,x,y,ex,ey);

  gr->Draw("");

  //gr->Fit("fit7","R");
//hist7->SetErrorX(0.5);
// hist7->SetMarkerStyle(20);
// hist7->GetXaxis()->SetTitle("Intensite LED (U.A)");
// hist7->GetYaxis()->SetTitle("Charge moyenne (U.A)");
// hist7->GetXaxis()->SetTitleSize(0.04);
// hist7->GetYaxis()->SetTitleSize(0.03);
// hist7->GetXaxis()->SetLabelSize(0.05);
// hist7->GetYaxis()->SetLabelSize(0.05);
// hist7->Draw("");


//c1->Print(Form("/home/kdupuy/Documents/Line/%03i1.png", j));

	//delete hist7;
}
}

valeurspics2.root (35.7 KB)

Your macro cannot work as it was. I clean up a bit as follow:

void OMline() {
   gStyle->SetOptStat(0);
   gStyle->SetOptFit(1111);

   TFile *input = new TFile("valeurspics2.root","READ");

   TTree *tree = (TTree*)input->Get("valeurspics2_tree;1");

   double Constant1, Mean1, Sigma1, om_number1;
   int pics, intensity;
   Double_t error1, error2, error3;
   Double_t x[6], y[6],ex[6],ey[6];
   Int_t n = 6;

   tree->SetBranchAddress("om_number1", &om_number1);
   tree->SetBranchAddress("Constant1", &Constant1);
   tree->SetBranchAddress("Mean1", &Mean1);
   tree->SetBranchAddress("Sigma1", &Sigma1);
   tree->SetBranchAddress("pics", &pics);
   tree->SetBranchAddress("intensity", &intensity);
   tree->SetBranchAddress("error1", &error1);
   tree->SetBranchAddress("error2", &error2);
   tree->SetBranchAddress("error3", &error3);

   int entries = tree->GetEntries();

   for (int j = 301; j <= 301; j++ ) {
      TF1 *fit7 = new TF1("fit7", "pol1", 0, 400000);
      for (int i=0; i < entries; i++) {
         tree->GetEntry(i);
         if (om_number1 == j) {
            for (Int_t i=0;i<n;i++) {
               cout << intensity << endl;
               x[i] = intensity;
               y[i] = Mean1;
               ex[i] = error2;
               ey[i] = 0;
            }
         }
      }
      TGraph* gr = new TGraphErrors(n,x,y,ex,ey);
      gr->Draw("AL");
   }
}

Indeed this macro makes no sense because only the last graph is plotted I propose you a new version using TMultiGraph which make more sense.

void OMline() {
   gStyle->SetOptStat(0);
   gStyle->SetOptFit(1111);

   TFile *input = new TFile("valeurspics2.root","READ");

   TTree *tree = (TTree*)input->Get("valeurspics2_tree;1");

   double Constant1, Mean1, Sigma1, om_number1;
   int pics, intensity;
   Double_t error1, error2, error3;
   Double_t x[6], y[6],ex[6],ey[6];
   Int_t n = 6;

   tree->SetBranchAddress("om_number1", &om_number1);
   tree->SetBranchAddress("Constant1", &Constant1);
   tree->SetBranchAddress("Mean1", &Mean1);
   tree->SetBranchAddress("Sigma1", &Sigma1);
   tree->SetBranchAddress("pics", &pics);
   tree->SetBranchAddress("intensity", &intensity);
   tree->SetBranchAddress("error1", &error1);
   tree->SetBranchAddress("error2", &error2);
   tree->SetBranchAddress("error3", &error3);

   int entries = tree->GetEntries();

   auto mg = new TMultiGraph();

   int j = 301;
   TF1 *fit7 = new TF1("fit7", "pol1", 0, 400000);
   for (int i=0; i < entries; i++) {
      tree->GetEntry(i);
      if (om_number1 == j) {
         for (Int_t i=0;i<n;i++) {
            x[i] = intensity;
            y[i] = Mean1;
            ex[i] = error2;
            ey[i] = 0;
         }
         TGraph* gr = new TGraphErrors(n,x,y,ex,ey);
         mg->Add(gr);
      }
   }
   mg->Draw("AL");
}

1 Like

What about this:

void OMline()
{
    gStyle->SetOptStat(0);
    gStyle->SetOptFit(1111);

    TCanvas *c1 = new TCanvas("c1","",0,10,0,500000);

    TFile *input = new 
    TFile("/home/kdupuy/Documents/fichier_root/valeurspics2.root","READ");

    TTree *tree = (TTree*)input->Get("valeurspics2_tree;1");
    tree->SetEstimate(-1);
    for(int j=301; j<=301;j++)
    {
        int nData = tree->Draw("intensity:Mean1:error2", ("om_number1=="+to_string(j)).c_str(), "goff");
        double *x=tree->GetVal(0);
        double *y=tree->GetVal(1);
        double *ex=tree->GetVal(2);
        TGraphErrors *gr = new TGraphErrors(nData, x, y, ex);
        gr->DrawClone("AP*");
        gr->Fit("pol1");

       // TH2D *hist7 = new TH2D("hist7", "",1000, 60, 130, 1000, 0, 500000);
       // for(int i=0; i<nData; i++)
       //     hist7->Fill(x[i], y[i]);
    }
    

1 Like

I don’t understand why, with my precedent programm, just the last graph is plotted ?
But thank you for the new version

Because you were drawing the graph in a loop and only the last “Draw” was visible. They were overwriting each other.

1 Like