This my code
#include <TROOT.h>
#include <TChain.h>
#include <TTree.h>
#include <TFile.h>
#include <TCanvas.h>
#include <TStyle.h>
#include <TH2F.h>
#include <TH1F.h>
#include <TF1.h>
#include <TMath.h>
#include <TSpectrum.h>
#include <TGraph.h>
#include <fstream>
#include <TProof.h>
#include <TProfile.h>
#include <Hoption.h>

double MyFitFun( double *x, double *par );

void sim()
{
    double DCR, Voltage;
    double mean;
    Int_t n =0;
    //==========loading root File==========


    TChain *chain = new TChain("da");

    chain->Add("xx.root");
    chain->Add("xx1.root");


    chain->SetBranchAddress( "DCR", &DCR);
    chain->SetBranchAddress( "Voltage", &Voltage);

    //========= Create Canvas ===========
    TCanvas *canvas = new TCanvas( "c1","This is Test Canvs ", 2000, 3000 );
    canvas->Divide( 2, 1);
    canvas->cd(1);

    TProfile *result = new TProfile(" h1 ", " DCR vs Voltage ", 15, 1275, 2025);

    //==========Iterate over events===========
    double count_number = 0;
    double count = 0;
    Long64_t nentries = chain->GetEntries();
    cout << " nentries: " << nentries << endl;

    //========== Directly fill ==============
    for( Long64_t jentry =0; jentry< nentries; jentry++)
    {
        chain->GetEntry(jentry);

        if( DCR != -1)
        {

            result ->Fill( Voltage, DCR);
        }
    }

    cout << " The program over !!!!! " << endl;
    result->SetErrorOption("i");
    result->SetMarkerStyle(20);
    result->SetMarkerSize(1);


    TF1 *myfit = new TF1( "myfit" , MyFitFun, 1275, 2025, 2);

    myfit->SetParameter( 0, 0.5 );
    myfit->SetParameter( 1, 0.5 );

    result->Fit("myfit");

    //cout << "BinWidth :" << result->GetBinWidth(1) << endl;
    //cout << " last : " << result->GetBinLowEdge(16) << endl;
    gStyle->SetOptStat( kFALSE );
    //gPad->SetLogy();

    result->Draw();


    // Define an exponential function where [0] and [1] are the parameters to be fitted
    // and 1275 and 2025 are the range to be fitted.
}
    //======== Fit ============
double MyFitFun( double *x, double *par )
{
    double FitRes = 1.0;
    FitRes = par[0] * exp( -x[0]/par[1] );

    return FitRes;
}
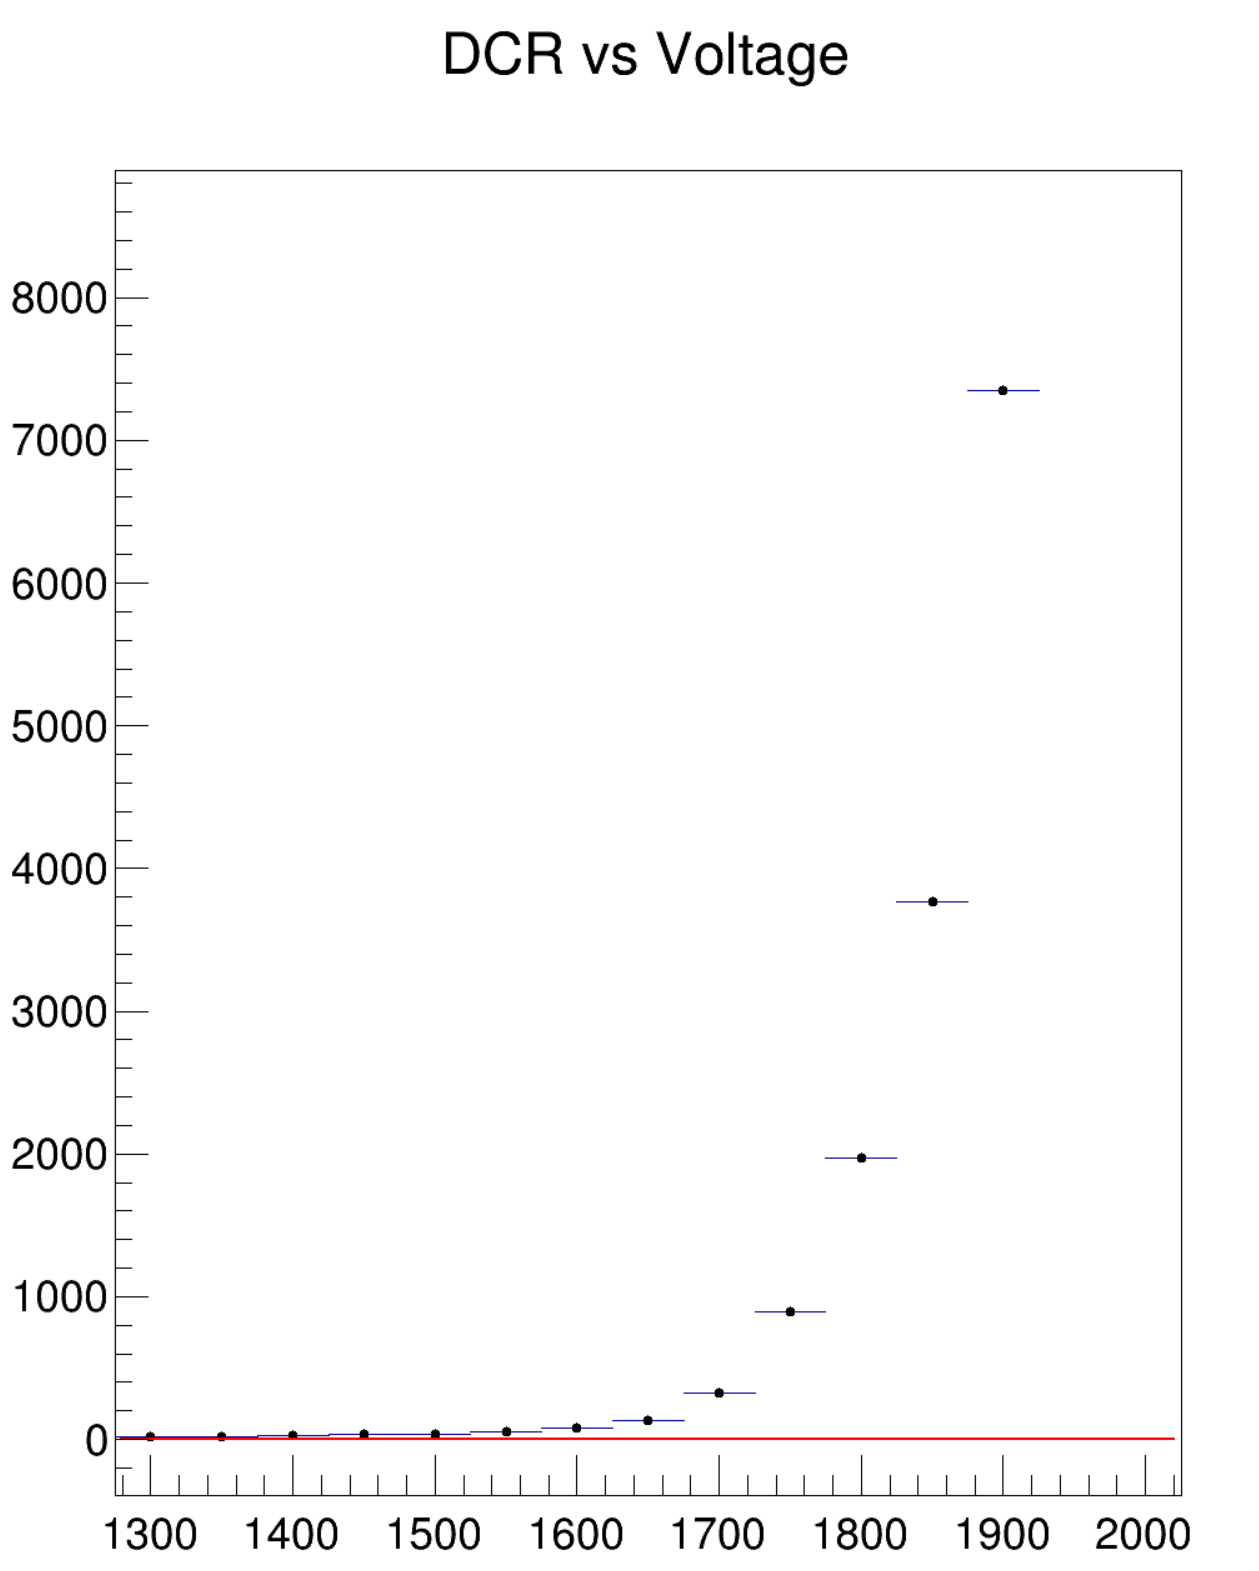
The code was able to run successfully with the following results
How do I change the code?