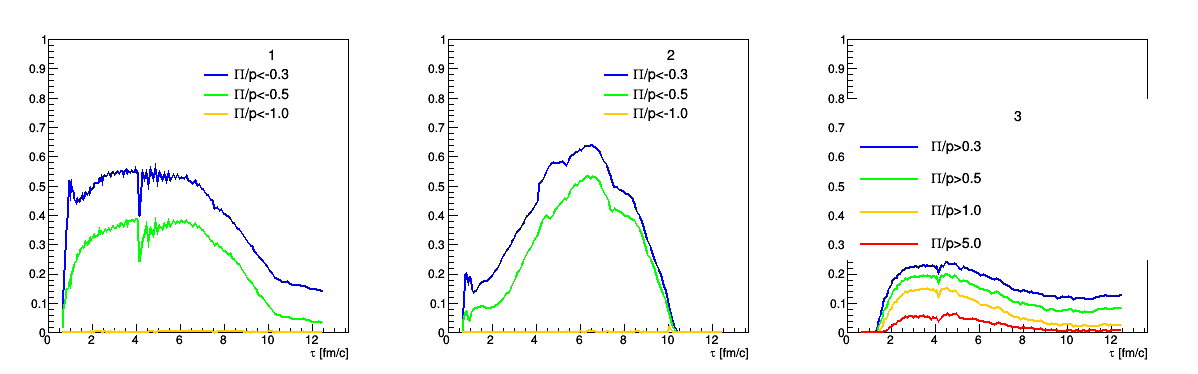
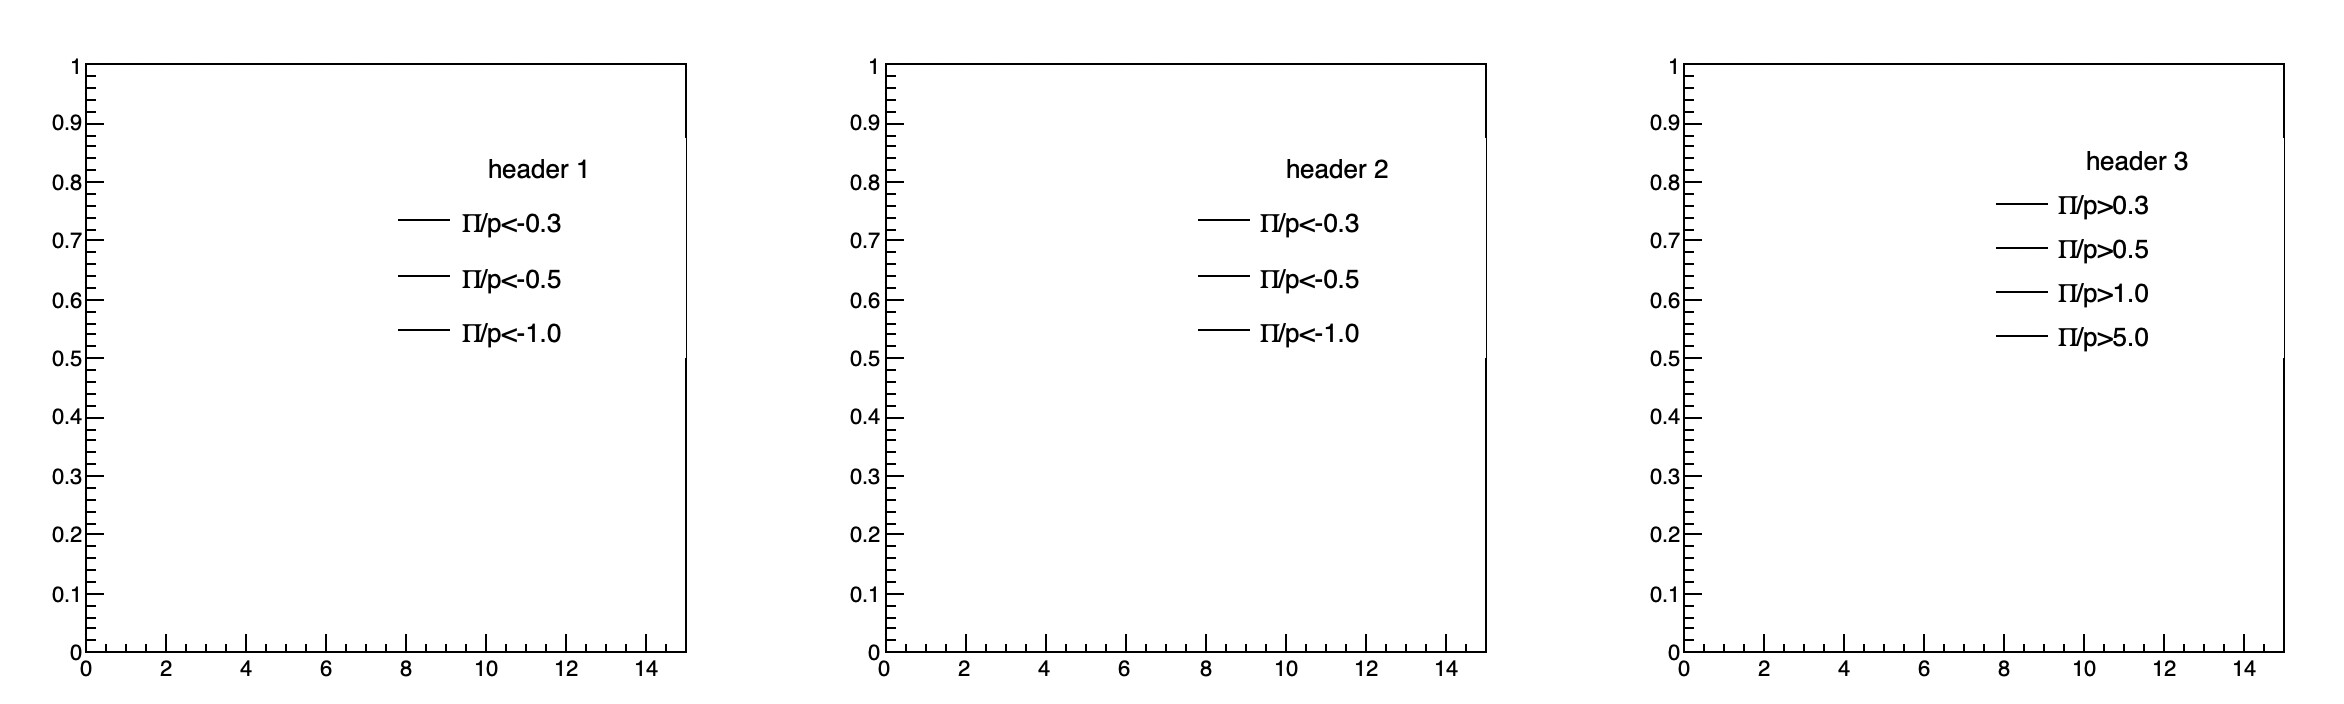
So I have ten TGraphs (plots[i]) and I’d like to have a legend for every set of graphs (legend1, legend2, and legend3). For some reason, legend3 doesn’t seem to work and I don’t know why (legend1 and legend2 are correct)… I tried to play with it a little bit (i.e. having 3 entries instead of four) but without any success. Probably something goes over my head instead of this being a bug but I really don’t know what to do. Thanks a lot for any help.
Here’s the important part of the code and output:
TCanvas *c1 = new TCanvas("c1","GraphDraw",0,0,1200,400);
c1->Divide(3,1);

c1->cd(1);
plots[0]->Draw();
plots[1]->Draw("SAME");
plots[2]->Draw("SAME");
TLegend *legend1 = new TLegend(0.89,0.44,0.89,0.44);
legend1->SetTextSize(0.04);
legend1->SetHeader("1","C");
legend1->AddEntry(plots[0], "#Pi/p<-0.3", "l");
legend1->AddEntry(plots[1], "#Pi/p<-0.5", "l");
legend1->AddEntry(plots[2], "#Pi/p<-1.0", "l");
legend1->SetBorderSize(0);
legend1->Draw();


c1->cd(2);
plots[3]->Draw();
plots[4]->Draw("SAME");
plots[5]->Draw("SAME");
TLegend *legend2 = new TLegend(0.89,0.44,0.89,0.44);
legend2->SetTextSize(0.04);
legend2->SetHeader("2","C");
legend2->AddEntry(plots[3], "#Pi/p<-0.3", "l");
legend2->AddEntry(plots[4], "#Pi/p<-0.5", "l");
legend2->AddEntry(plots[5], "#Pi/p<-1.0", "l");
legend2->SetBorderSize(0);
legend2->Draw();

c1->cd(3);
plots[6]->Draw();
plots[7]->Draw("SAME");
plots[8]->Draw("SAME");
plots[9]->Draw("SAME");
TLegend *legend3 = new TLegend(0.89,0.44,0.89,0.44);
legend3->SetTextSize(0.04);
legend3->SetHeader("3","C");
legend3->AddEntry(plots[6], "#Pi/p>0.3", "l");
legend3->AddEntry(plots[7], "#Pi/p>0.5", "l");
legend3->AddEntry(plots[8], "#Pi/p>1.0", "l");
legend3->AddEntry(plots[9], "#Pi/p>5.0", "l");
legend3->SetBorderSize(0);
legend3->Draw();
c1->Print("result.pdf");