ROOT Version: 6.13Platform: Ubuntu 16.04Compiler: gcc530
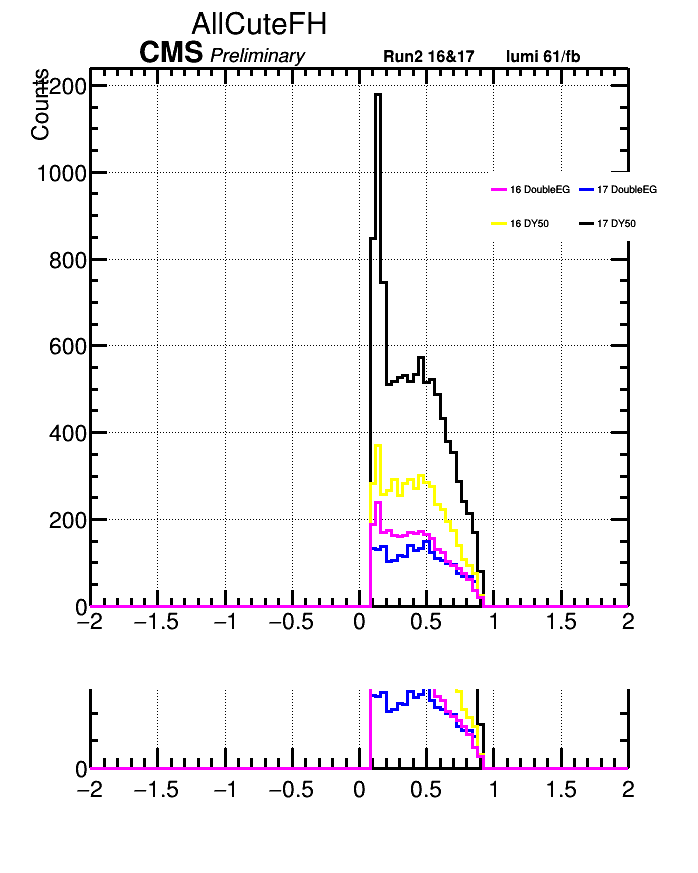
Hi, when I save my canvas of histogram in root, it shows the weirrd image of plots at the bottom of window, like this.
Relevant code I use to plot and save the window is
c1 = TCanvas( 'c%s' %num, 'Histogram Drawing Options', 200, 200, 700, 900 )
                c1.SetGrid()
                gPad.SetLeftMargin(0.13)
                gPad.SetBottomMargin(0.12)
                gPad.SetTickx()
                gPad.SetTicky()
                gStyle.SetOptStat(0)
                gStyle.SetLineWidth(3)
                gStyle.SetHistLineWidth(3)
                c1.Modified()
                c1.Update()
                c1.SaveAs('jet/%s_%s.png'%(Channel,Var))
Does anyone know how to get rid of the bottom cut image?
couet
July 11, 2019, 2:47pm
2
your code, as expected, gives a blank canvas.
{
   TCanvas c1( "c1", "Histogram Drawing Options", 200, 200, 700, 900 );
   c1.SetGrid();
   gPad->SetLeftMargin(0.13);
   gPad->SetBottomMargin(0.12);
   gPad->SetTickx();
   gPad->SetTicky();
   gStyle->SetOptStat(0);
   gStyle->SetLineWidth(3);
   gStyle->SetHistLineWidth(3);
   c1.Draw();
   c1.Modified();
   c1.Update();
   c1.SaveAs("trenta1.png");
}
                c1 = TCanvas( 'c%s' %num, 'Histogram Drawing Options', 200, 200, 700, 900 )
                c1.SetGrid()
                gPad.SetLeftMargin(0.13)
                gPad.SetBottomMargin(0.12)
                gPad.SetTickx()
                gPad.SetTicky()
                gStyle.SetOptStat(0)
                gStyle.SetLineWidth(3)
                gStyle.SetHistLineWidth(3)
                Channel = Region[i]
                Var = TV[j]
                _file0 = TFile.Open('/uscms/home/skim2/nobackup/LLDJ_slc6_530_CMSSW_8_0_26_patch1/src/LLDJstandalones/analyzers/free/Data_DoubleEG_G_%s_histograms.root' %Channel,'read')
                _file1 = TFile.Open('/uscms/home/skim2/nobackup/2017-LLDJ_slc7_630_CMSSW_9_4_10/src/2017lldj/analyzers/free/Data_DoubleEG_B_%s_histograms.root' %Channel,'read')
                _file2 = TFile.Open('/uscms/home/skim2/nobackup/LLDJ_slc6_530_CMSSW_8_0_26_patch1/src/LLDJstandalones/analyzers/free/DYJetsToLL_M-50_%s_histograms.root' %Channel,'read')
                _file3 = TFile.Open('/uscms/home/skim2/nobackup/2017-LLDJ_slc7_630_CMSSW_9_4_10/src/2017lldj/analyzers/free/DYJetsToLL_M-50_%s_histograms.root' %Channel,'read')

             h0=_file0.Get('h_%s_%s'%(Channel,Var))
                h1=_file1.Get('h_%s_%s'%(Channel,Var))
                h2=_file2.Get('h_%s_%s'%(Channel,Var))
                h3=_file3.Get('h_%s_%s'%(Channel,Var))
               h0.SetTitle('TwoEle_%s Hist' %Var)
                h0.GetXaxis().SetTitle('%s' %Var)
                #h0.GetXaxis().SetRangeUser(-1,6)

                h3.GetYaxis().SetTitle('Counts')
                h3.GetYaxis().SetTitleOffset(1.3)
                #h3.Scale(1./h3.Integral())
                h3.SetLineColor(1)
                h3.Draw('HIST')
                #h1.Scale(1./h1.Integral())
                h1.SetLineColor(4)
                h1.Draw('HIST SAME')
                #h2.Scale(1./h2.Integral())
                h2.SetLineColor(5)
                h2.Draw('HIST SAME')
                #h3.Scale(1./h3.Integral())
                h0.SetLineColor(6)
                h0.Draw('HIST SAME')
                #h0.GetYaxis().SetRangeUser(0,.2)

                legend = TLegend(0.70,0.65,0.95,0.75)
                legend.SetBorderSize(0)
                legend.SetTextSize(0.015)
                legend.SetNColumns(2)
                legend.SetFillColor(kWhite)
                legend.AddEntry(h0,"16 DoubleEG","l")
                legend.AddEntry(h1,"17 DoubleEG","l")
                legend.AddEntry(h2,"16 DY50","l")
                legend.AddEntry(h3,"17 DY50","l")
                legend.Draw()
                title = TText(1,1,"")
                title.SetTextSize(0.045)
                title.SetTextColor(kBlack)
                title.SetTextAlign(11)
                title.SetTextFont(62)

                extra = TText(1,1,"")
                extra.SetTextSize(0.03)
                extra.SetTextColor(kBlack)
                extra.SetTextAlign(11)
                extra.SetTextFont(52)

                extra2 = TLatex(1,1,"")
                extra2.SetTextSize(0.025)
                extra2.SetTextColor(kBlack)
                extra2.SetTextAlign(11)
                extra2.SetTextFont(62)
                title.DrawTextNDC(0.2,0.91,"CMS")
                extra.DrawTextNDC(0.3,0.91,"Preliminary")
                extra2.DrawLatexNDC(0.55,0.91,"Run2 16&17       lumi 61/fb")
                c1.Modified()
                c1.Update()
                c1.SaveAs('jet/%s_%s.png'%(Channel,Var))
couet
July 11, 2019, 3:05pm
4
We cannot run your code. We do not have the root files.
couet
July 11, 2019, 3:44pm
6
I have removed the full path name of your files (I do not have them) so the file opening is now:
		_file0 = TFile.Open('Data_DoubleEG_G_%s_histograms.root' %Channel,'read')
		_file1 = TFile.Open('Data_DoubleEG_B_%s_histograms.root' %Channel,'read')
		_file2 = TFile.Open('DYJetsToLL_M-50_%s_histograms.root' %Channel,'read')
		_file3 = TFile.Open('DYJetsToLL_M-50_%s_histograms.root' %Channel,'read')
and I get:
$ python script.py
Error in <TFile::TFile>: file DYJetsToLL_M-50_TwoEleZH_histograms.root does not exist
Error in <TFile::TFile>: file DYJetsToLL_M-50_TwoEleZH_histograms.root does not exist
Traceback (most recent call last):
  File "script.py", line 51, in <module>
    h2=_file2.Get('h_%s_%s'%(Channel,Var))
ReferenceError: attempt to access a null-pointer
Sorry, I solved it by moving c1.SaveAs() After the enter function.
Once the canvas was saved after being adjusted to the proper size (giving time to do so by having enter function before SaveAs()), it worked.
system
July 25, 2019, 6:13pm
8
This topic was automatically closed 14 days after the last reply. New replies are no longer allowed.