Dear all,
Thanks in advance
_ROOT Version: 6.18
To add a reproducer:
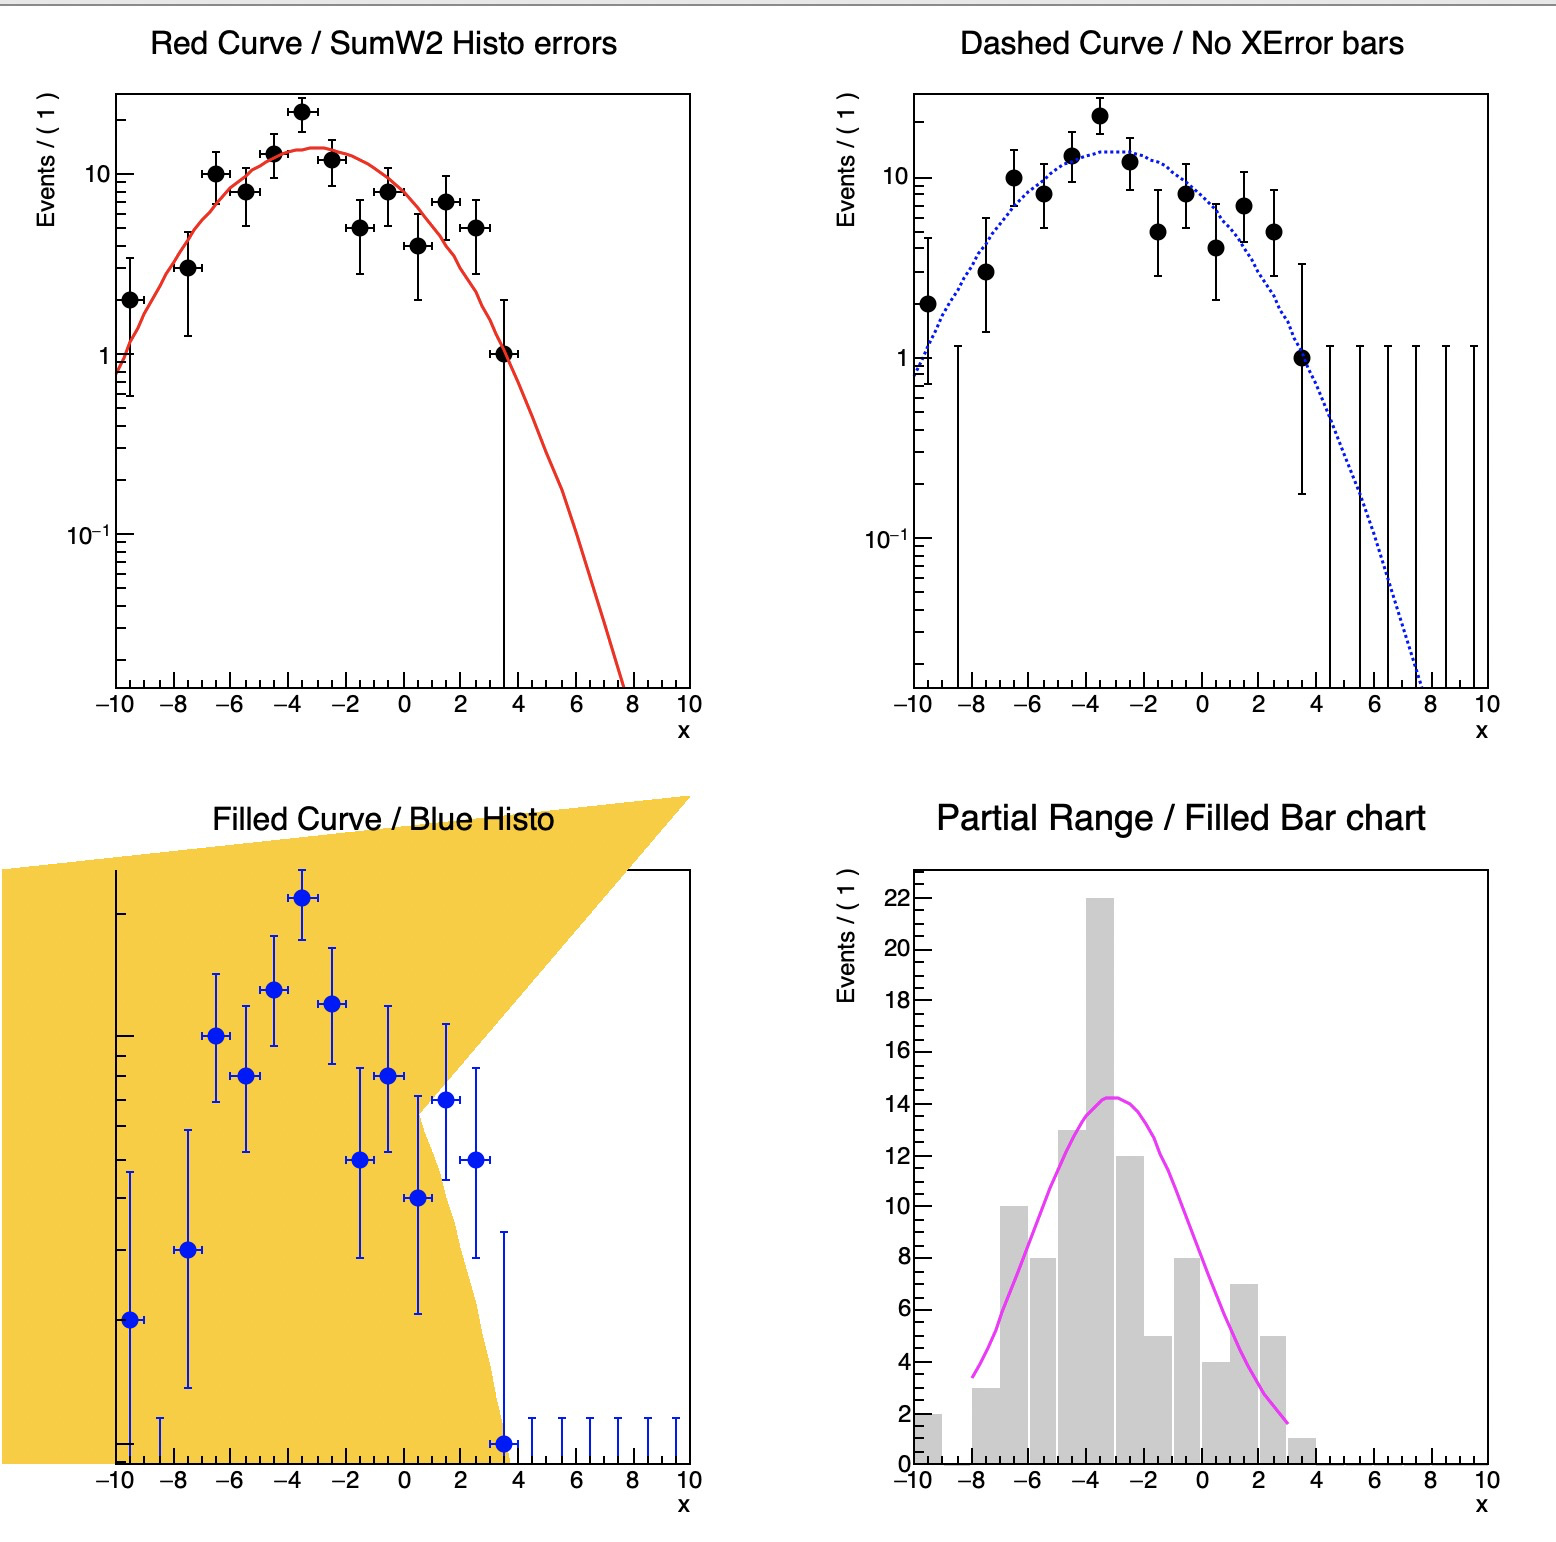
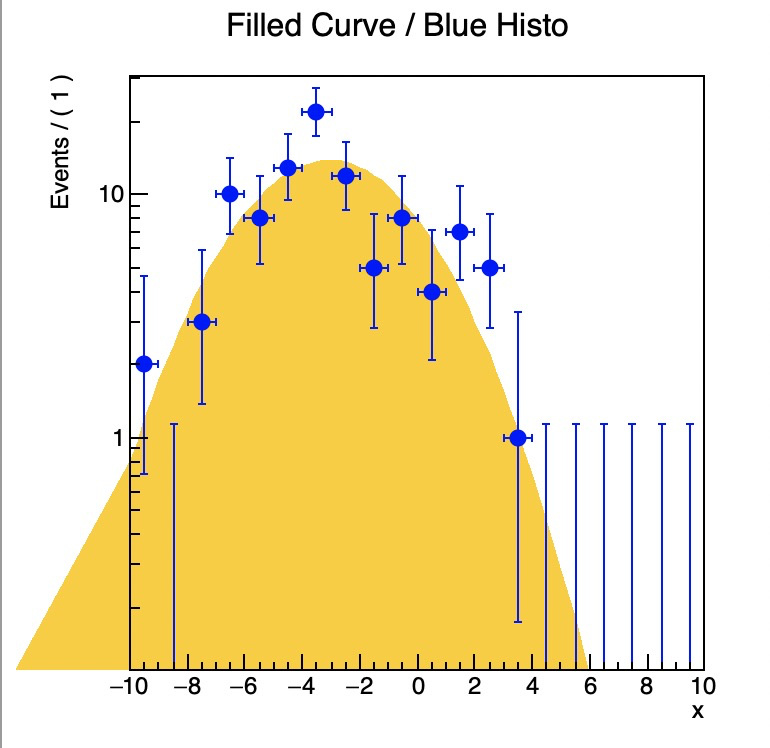
If you run this macro in the tutorials and you take the plots produced and setLogY() you will see someething like this ( only for the FilledCurves ) .
TO add again ,VLines() to thee Drawing i get :
I don’t think this is expected.
couet
September 9, 2019, 8:30am
4
I’ll check the rf example you pointed.
Just to add, if interactively I click thee plot before setting LogY, i get the plot correct. Is there a way to “emulate” a click in a macro?
couet
September 9, 2019, 8:33am
6
Something looks wrong … let me check.
couet
September 10, 2019, 8:28am
7
I managed to reproduce the effect with the following simple macro:
{
   TCanvas *C = new TCanvas("C", "C",0,45,800,800);
   C->SetLogy();
   Double_t X[5] = { -11.0, -10.5, -10.0, -9.5, -9.0, };
   Double_t Y[5] = { 0.0000, 0.0080, 0.0085, 0.0090, 0.0095, };
   TGraph *graph = new TGraph(5,X,Y);
   graph->Draw("al*");
}
Looking at it…
couet
September 10, 2019, 1:05pm
8
I found the problem. It is fixed in the ROOT master now.
pamputt
September 10, 2019, 1:11pm
9
@couet , since the bug has been introduced by this commit , does it change something about the line clipping improvement introduced by this commit?
couet
September 10, 2019, 1:16pm
10
@pamputt :
1 Like
Is there any workaround for ROOT 6.18 that can be used?
system
September 24, 2019, 1:57pm
13
This topic was automatically closed 14 days after the last reply. New replies are no longer allowed.