Weird behavior when using option "same" when plotting branches

Hello everyone,

I am using this very simple script to plot a function of branches from my tree:

void plotbias2(){

	TFile *f = new TFile("file.root");
	TTree *data = (TTree*)f->Get("data");

	TH2F * h2 = new TH2F("h2", "h2", 50, 0, 200, 50, -20, 50);
	TH2F * h3 = new TH2F("h3", "h3", 50, 0, 200, 50, -20, 50);

	data->Draw("(ErecS-MCe0)/MCe0:MCe0>>h2", "ErecS>0 && Chi2>=0", "proff");
	data->Draw("(2*(ErecS-MCe0)/MCe0):MCe0>>h3", "ErecS>=0 && Chi2>=0", "proff SAME");
}

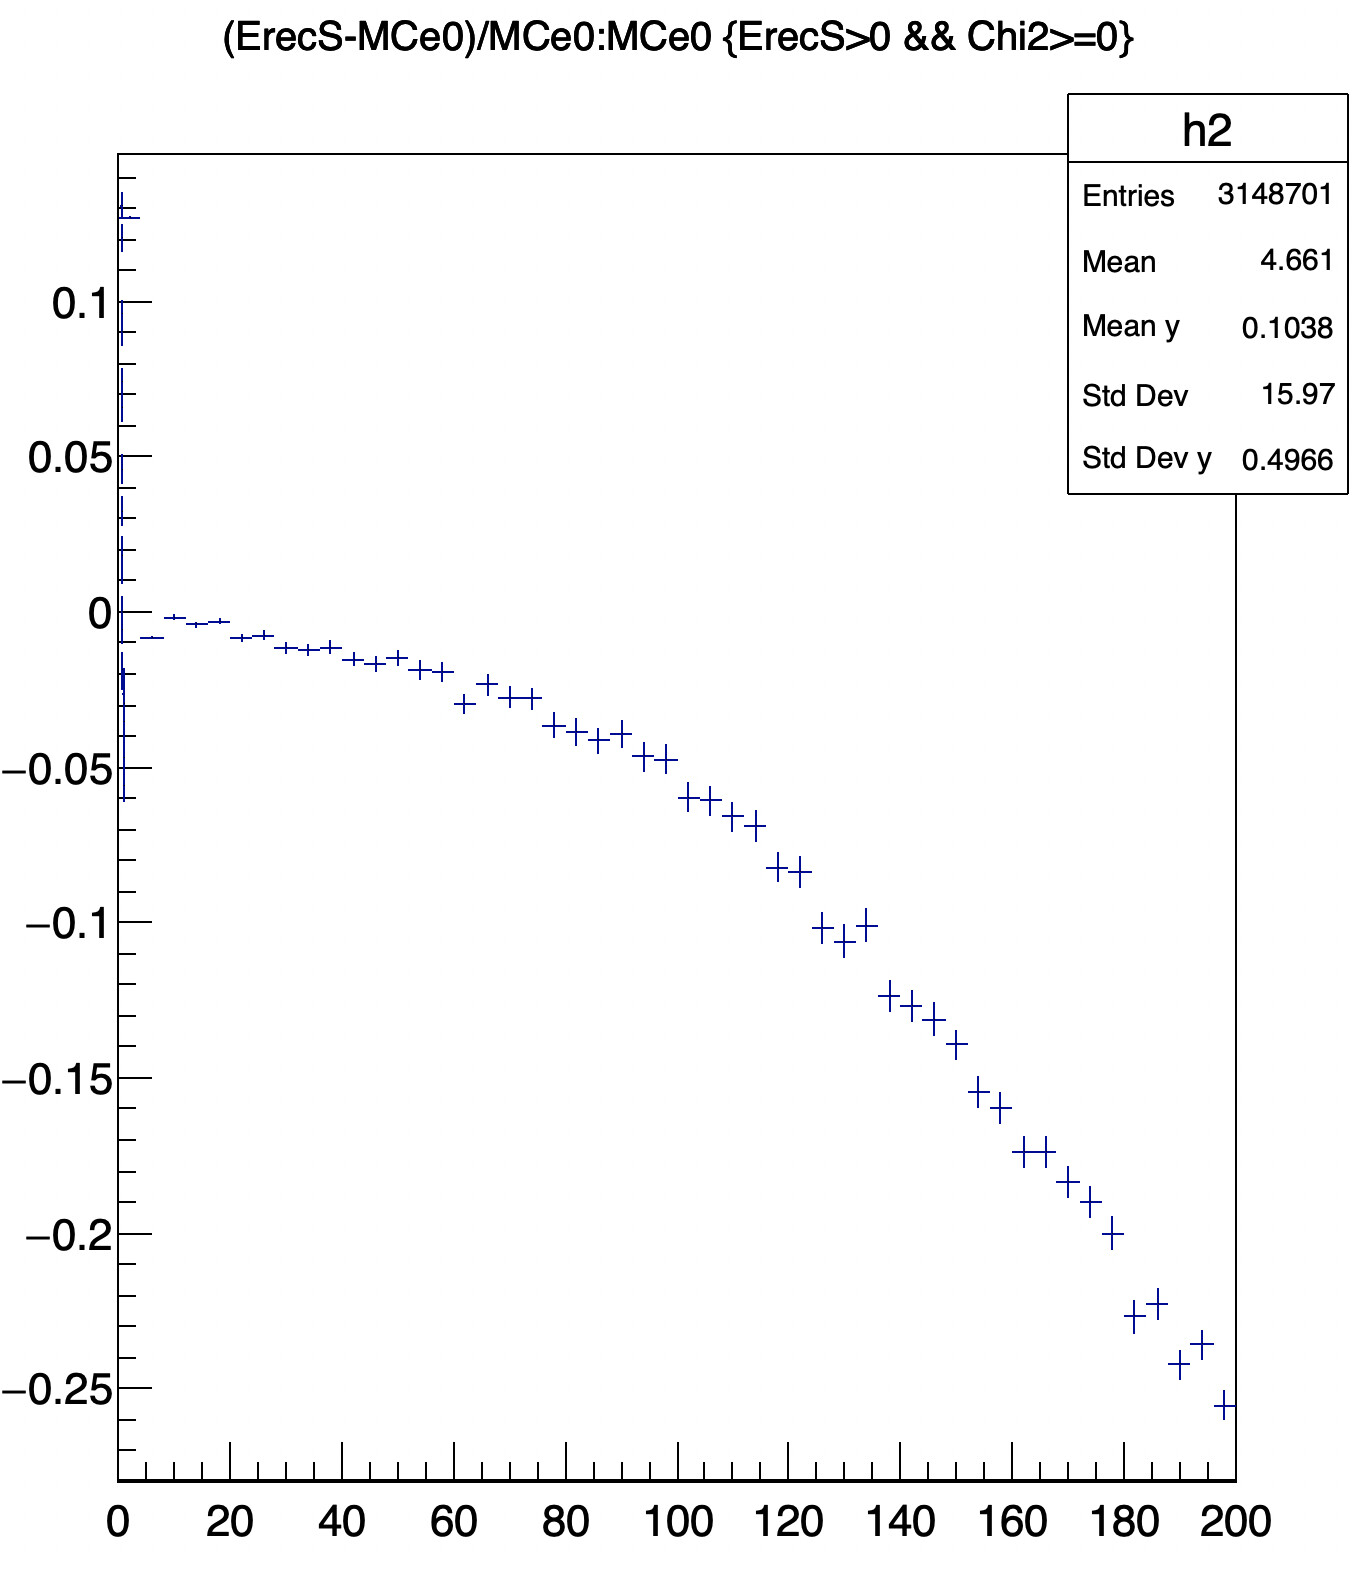
as you can see, the plot is very weird. One hist should just be 2x the other. No idea why it happens since both hists have same range and bins. Do you know how to solve this?

Funny thing: when I use

data->Draw("(ErecS-MCe0)/MCe0:MCe0", "ErecS>0 && Chi2>=0", "proff");

it works fine.


Please read tips for efficient and successful posting and posting code

ROOT Version: 6.24/06 and same happens for 5.34/36
_Platform: macOS Catalina
Compiler: Not Provided


What is the option “proff” ?

With “proff” I get a plot that in each bin I have the mean + standard deviation value of the Y projection in that specific bin.

I am asking because I did a git grep -i proff on the whole ROOT source code and could not find track of this option. It does not appear in the TTree documentation either . I should have missed something … can you point the piece of documentation describing this option ? Invalid options may have unknown effects.

I actually found out about this option through co-workers and have been using it with no issues since. Indeed I couldn’t find it on the documentation.

I think it was supposed to be prof, not proff (see chapter 14.20.11.2 here). Also, there is a possibility to add a letter after prof, but only profs, profi, and profg cases exist (see here). So I think the trailing f simply gets ignored, so at the end of the day proff is the same as prof.

Using only ‘prof’ however couldn’t solve the problem :disappointed:

What do you get (just to see) if you remove the prof in both commands ?

if you want to use the “prof” option, your “h2” and “h3” need to be TProfile and not TH2F

Exactly, that’s why I suggested without “prof”. The 2 TH2F have the same X range so the histograms should be “visible on the same plot” according to X. Only if the Y ranges do not overlap you might not see the second one.

This topic was automatically closed 14 days after the last reply. New replies are no longer allowed.