Hi Couet,
Thanks, your output is just amazing it’s what I really want I run it by just changing “ci = 1433 to int ci = 1433” and, “color = … by TColor* color = …”
.
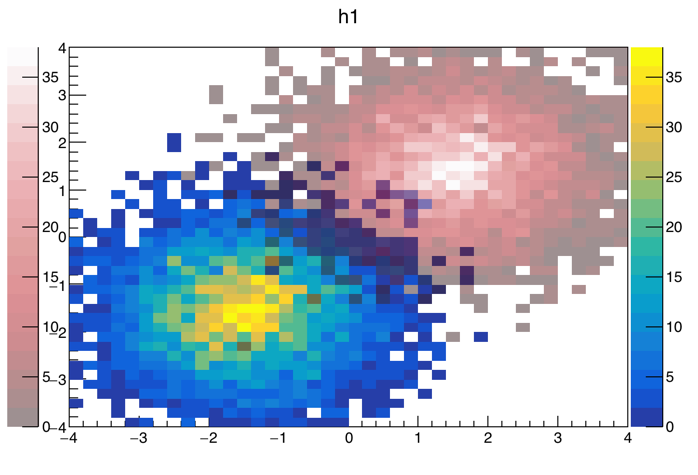
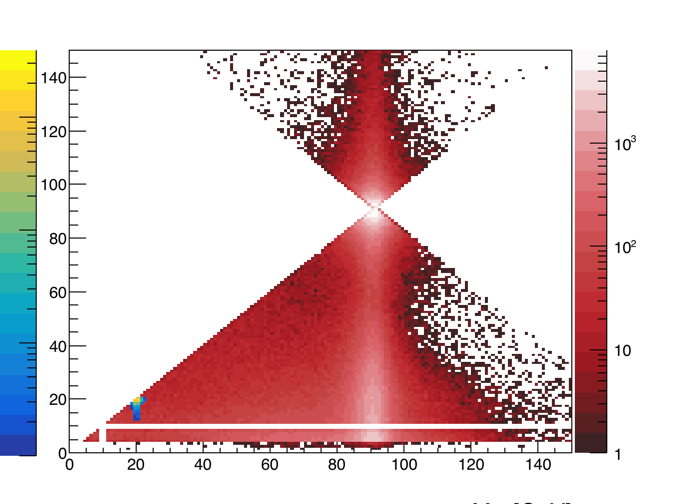
So I tried to repoduce this by modifying the code a little bit, but I go something strange, here the code modified for instance:
#include "TROOT.h"
#include "TObject.h"
#include "TFile.h"
#include "TTree.h"
#include "TH2.h"
#include "TMath.h"
#include "TGraph.h"
#include "TColor.h"
#include "TCanvas.h"
#include "TLegend.h"
#include <TStyle.h>
#include <iostream>
#include "AtlasStyle.h"
#include "TROOT.h"
void test1 ()
{ TCanvas *c1 = new TCanvas("c1");
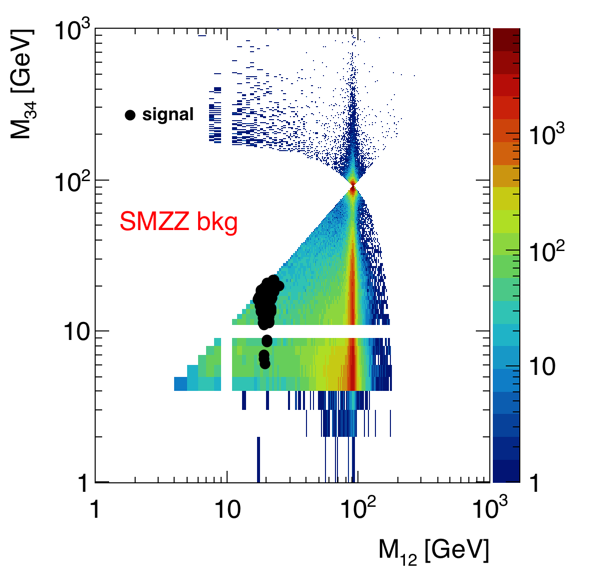
TFile* f0 = new TFile("summary_smzz_bkg.root");
TFile* f2 = new TFile("summary_20_175_signal.root");
TH2D *hM12_vs_M34_2e2m_smzz= (TH2D*)f0->Get("hM12_vs_M34_2e2m");
TH2D *hM12_vs_M34_2e2m_20_175 = (TH2D*)f2->Get("hM12_vs_M34_2e2m");
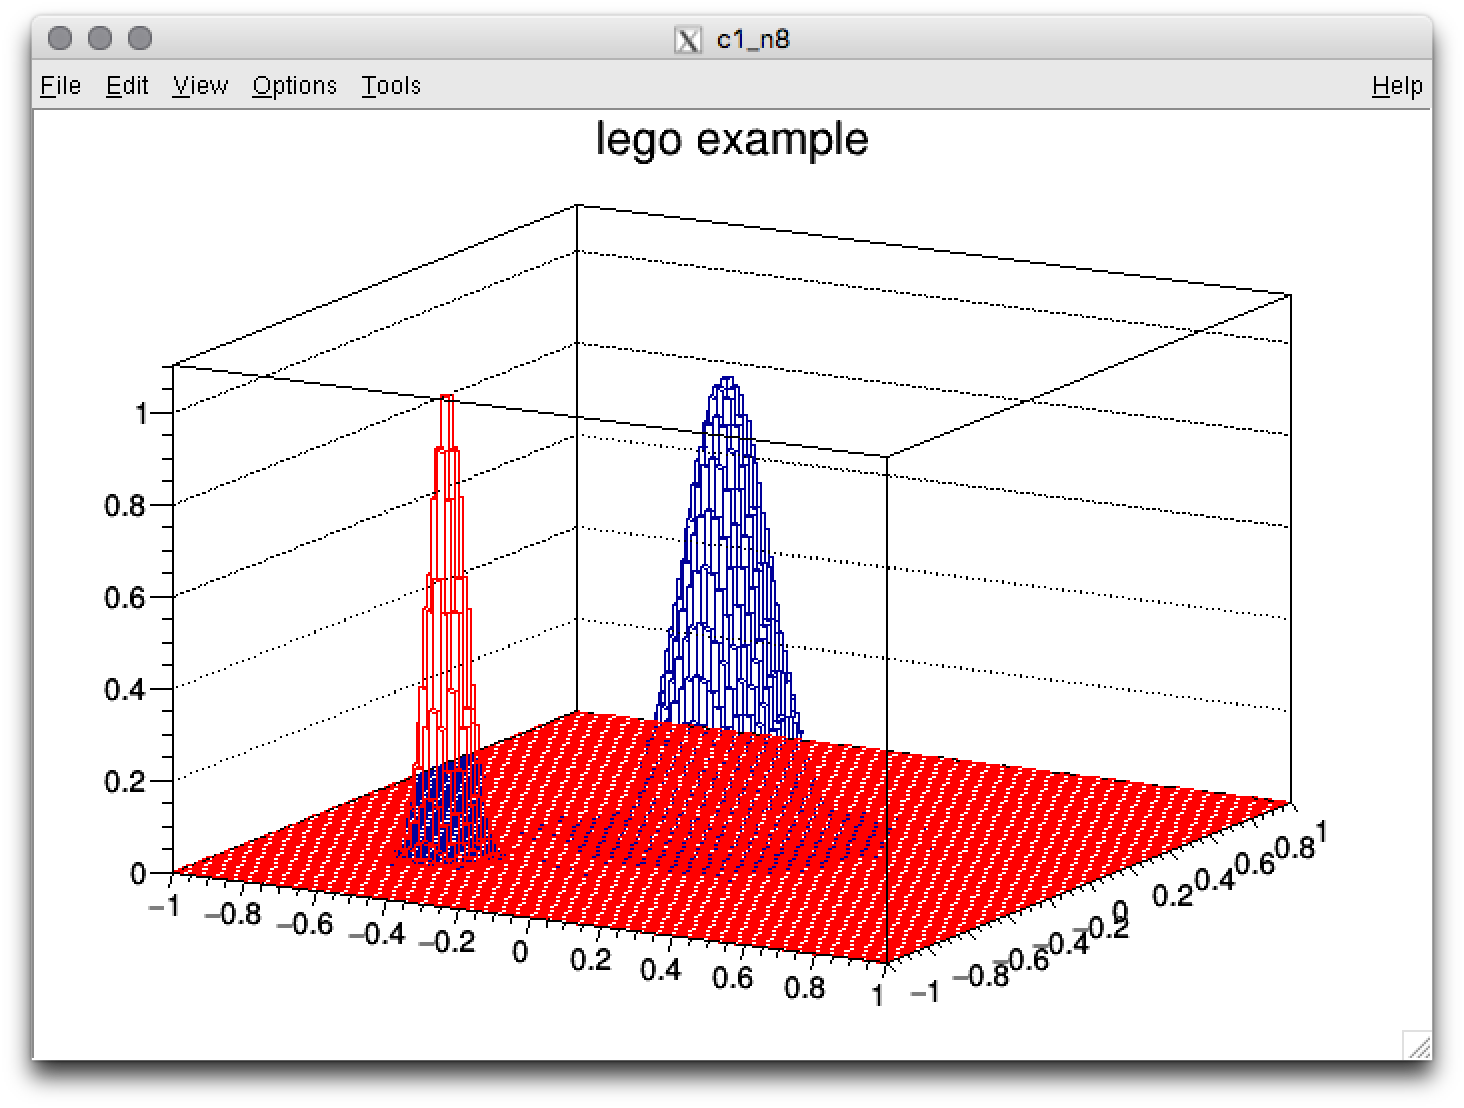
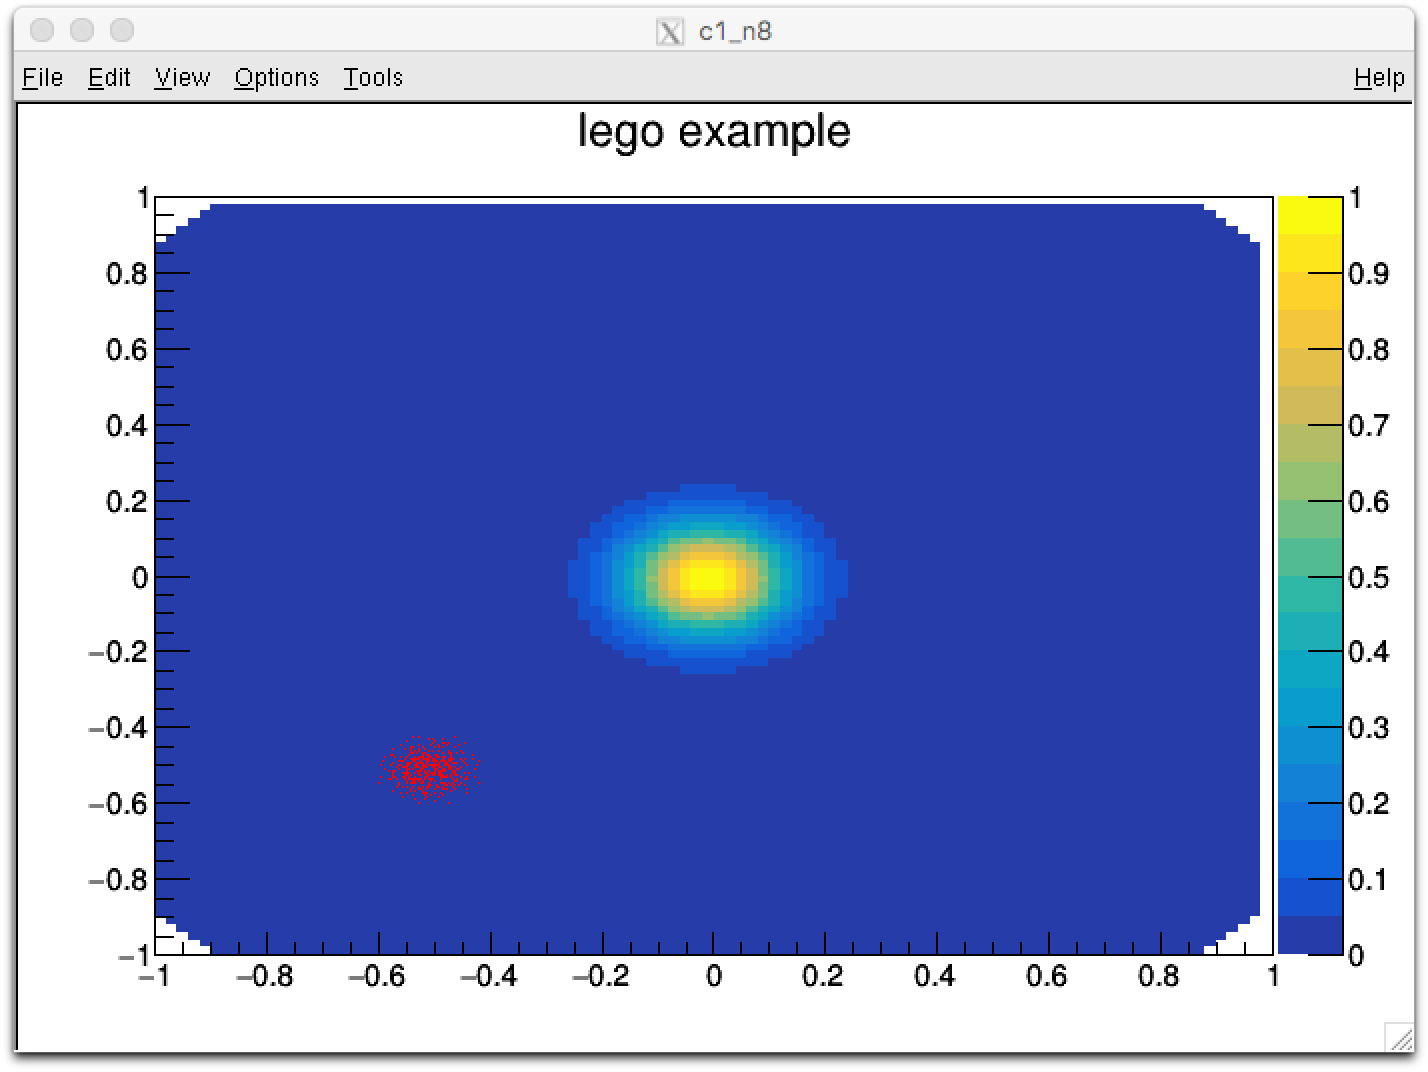
/* TH2F *h1 = new TH2F("h1","h1",40,-4,4,40,-4,4);
TH2F *h2 = new TH2F("h2","h2",40,-4,4,40,-4,4);
h1->SetBit(TH1::kNoStats);
h2->SetBit(TH1::kNoStats);
Double_t a,b;
for (Int_t i=0;i<5000;i++) {
gRandom->Rannor(a,b);
h1->Fill(a-1.5,b-1.5);
h2->Fill(a+1.5,b+1.5);
}*/
hM12_vs_M34_2e2m_smzz->SetBit(TH1::kNoStats);
hM12_vs_M34_2e2m_20_175->SetBit(TH1::kNoStats);
TExec *ex1 = new TExec("ex1","gStyle->SetPalette(kBird);");
TExec *ex2 = new TExec("ex2","gStyle->SetPalette(kCherry,0,0.5);");
hM12_vs_M34_2e2m_smzz->Draw("col");
ex1->Draw();
hM12_vs_M34_2e2m_smzz->Draw("colz same");
TPaletteAxis *palette = new TPaletteAxis(-4.899714,-3.989474,-4.441261,4.010526,hM12_vs_M34_2e2m_20_175);
palette->SetLabelColor(1);
palette->SetLabelFont(42);
palette->SetLabelOffset(0.005);
palette->SetLabelSize(0.035);
palette->SetTitleOffset(1);
palette->SetTitleSize(0.035);
int ci = 1433;
TColor * color = new TColor(ci, 0.9823529, 0.9762255, 0.9764706, " ", 0.5);
palette->SetFillColor(ci);
palette->SetFillStyle(1001);
hM12_vs_M34_2e2m_20_175->GetListOfFunctions()->Add(palette,"br");
ex2->Draw();
hM12_vs_M34_2e2m_20_175->Draw("colz same");
}
Could you tell me what’s wrong here please.
Thanks,
diallo