Dear ROOTers,
Apologies if this point has been raised before, I did not find a similar post on the forum.
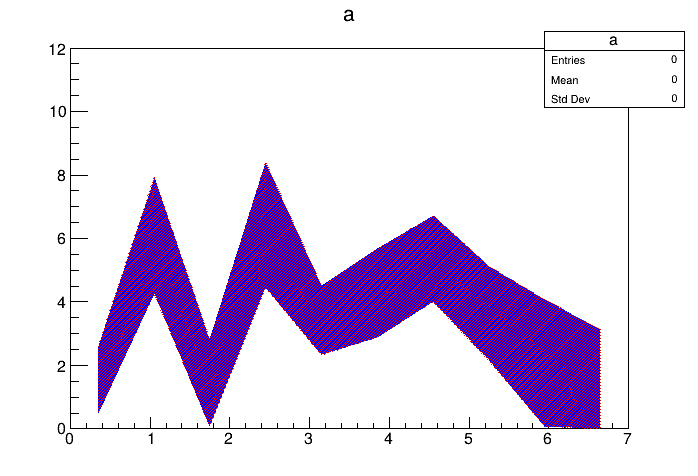
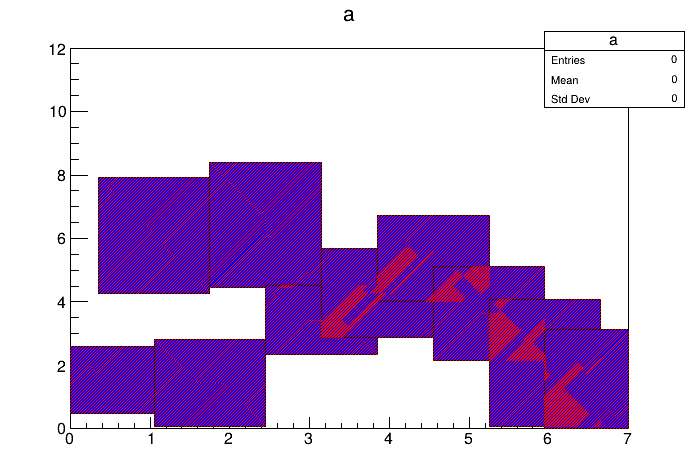
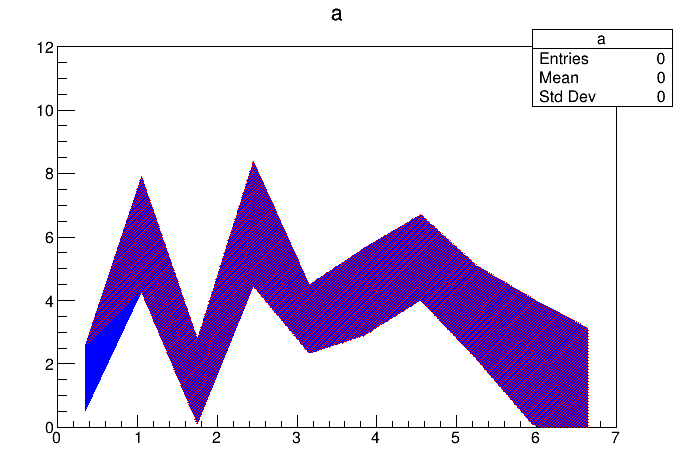
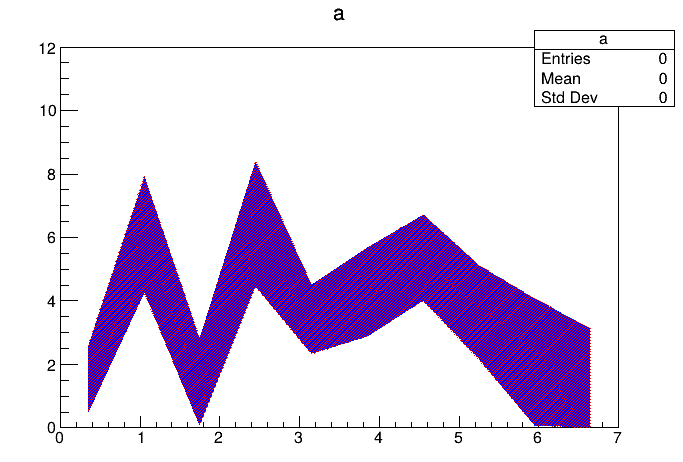
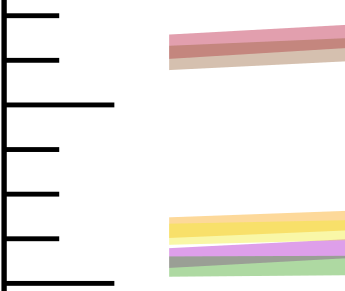
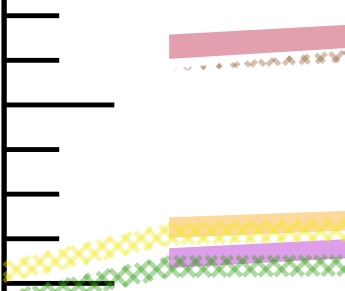
I am trying to plot a data histogram together with a few curves of theoretical predictions (TGraphAsymmErrors/TGraphErrors). If I set the fill style of the graphs to SetFillStyle(1001), I believe I am always obtaining the correct graph errors in the displayed range. However, if I have set the style to e.g. SetFillStyle(3154), in the cases the error bars extend outside of the Y-axis plotting range (even if the point is outside of the X-axis range), the uncertainty of the first point is plotted as if it is set to 0.
I attach two image displaying the issue. The brown, yellow and green graphs in the two pictures are the same apart from the fill style. The brown line displays the issue described above, while the other two display a separate issue, which I am currently unable to identify – they look as though there is an additional point on the left of the X-axis range.
I also attach an example script displaying the disappearing error of the first point.
Thank you,
Vangi
ErrorGraphFillStyle.cpp (1.4 KB)
EDIT: The ROOT version I used for the example script is ROOT 6.24/07