I recently found that there’s a way to draw violin plot with new dev version.
I tried to do that and partially succeeded.
Is there any way to draw y axis on sub-plots with log scale?
I saw TCandle has logy option, but there seems no way to activate it.
Turning on logy option in TStyle or TCanvas didn’t work.
Hi,
I implemented the candle and violin charts for TH2 in the master-branch last year. Log should work both axis. Usually log is actived by setting the option in gPad (or right-click) in the canvas
What do you mean with sub-plot? Maybe I’m misunderstanding you. Can you provide a small example, then we will get it working for sure
Georg
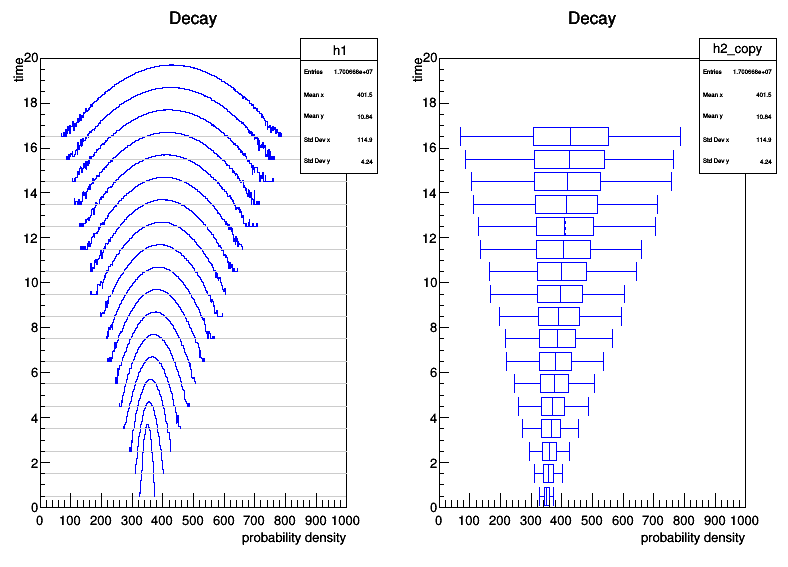
In that figure the blue lines are drawn in the normal axis.
If I do the log scale on either x or y axis, x axis works as intended I guess, but for y axis, it changes only the spacing between gray lines.
What I meant is the log scale drawing of blue lines.
Hi,
ok I do understand your concern.
in principle you would have to log the z-axis. But this will have no effect on the violin charts at the moment.
I will put that on my list :-),
Anyhow before this is going to work I also have to implement a possibility for a correct scaling of the violin charts. At the moment the histo-slices (that what you call the blue lines) are all scaled to each max-bin of each histo-slice, So histo-slices with different max-bin entries per slice should have different scales, but they aren’t currently.
A current workaround for you is to change the example you showed by using the following lines of code (please be aware that correct scaling is still not done):
void candledecay()
{
   TCanvas *c1 = new TCanvas("c1","Candle Decay",800,600);
   c1->Divide(2,1);
   TRandom *rand = new TRandom();
   TH2D *h1 = new TH2D("h1","Decay",1000,0,1000,20,0,20);

   float myRand;
   for (int i = 0; i < 17; i++) {
      for (int j = 0; j < 1000000; j++) {
         myRand = rand->Gaus(350+i*5,5+5*i);
         h1->Fill(myRand,i);
      }
   }
   h1->SetBarWidth(4);
   h1->SetFillStyle(0);
   h1->SetFillColor(kGray);
   h1->SetLineColor(kBlue);
   h1->GetYaxis()->SetTitle("time");
   h1->GetXaxis()->SetTitle("probability density");

   for (int x = 1; x <= h1->GetNbinsX(); ++x) {
	   for (int y = 1; y <= h1->GetNbinsY(); ++y) {
		   float myBin = h1->GetBinContent(x,y);
		   if (myBin > 0) h1->SetBinContent(x,y,TMath::Log10(myBin));
	   }
   }


   c1->cd(1);
   h1->Draw("violiny(12000000)");
   c1->cd(2);
   TH2I *h2 = (TH2I*)h1->Clone("h2");
   h2->SetBarWidth(0.8);
   h2->DrawCopy("candley2");
I added the other for loops for drawing bins lower than 1.
Double_t min = 9999;
for (int y = 1; y <= h1->GetNbinsY(); ++y) {
  for (int x = 1; x <= h1->GetNbinsX(); ++x) {
    float myBin = h1->GetBinContent(x,y);
    if (myBin > 0 && min > myBin)
      min = myBin;
  }
}
for (int y = 1; y <= h1->GetNbinsY(); ++y) {
  for (int x = 1; x <= h1->GetNbinsX(); ++x) {
    float myBin = h1->GetBinContent(x,y);
    if (myBin > 0) h1->SetBinContent(x, y, TMath::Log10(myBin) - TMath::Log10(min) + 1);
  }
}
That worked great!
Can I make one suggestion?
Is it possible to draw all the baselines first so that all the histo-slices are above the baseline?
I found sometimes the baselines hide the histo-slices quite a lot
Hi,
I do not understand for what you Need the second loop and the min variable. Might it be you have a problem with a float to int conversion? You have to change from TH2I to TH2D in order to visualize bins smaller than 1.
The draw is initiated slice by slice. That means that baseline and histo of the first slice is drawn, then the next and so on. Because of this it is not so easy to draw first all base lines then all histo. I will think about this.
Maybe it is easier to first draw a histo showing only the baseline and then initiate a second draw on the same histo showing only the histo without the baseline (in Connection with same).
h1->Draw("violiny(12000000)"); //Drawing baseline and histo
h1->Draw("violiny(10000000)"); //Drawing only baseline
h1->Draw("violiny(2000000)"); //Drawing only histo
Since the log10(x) values where 0<x<1 is negative,
they are not shown on the graph without an offset making the values to positive.
You can check that with the following code.
void test() {
  auto hist = new TH2D("hist", "", 100, 0, 100, 4, 0, 4);
  for (auto i = 0; i < 100; i++)
    hist -> Fill(i, 1, TMath::Log10(0.1 + i*0.001));

  for (auto i = 0; i < 100; i++)
    hist -> Fill(i, 2, TMath::Log10(10 + i*0.1));

  for (auto i = 0; i < 100; i++)
    hist -> Fill(i, 3, TMath::Log10(5 + 0.1 + i*0.001));

  hist -> SetStats(kFALSE);
  hist -> SetFillStyle(0);
  hist -> SetFillColor(kGray);
  hist -> SetLineColor(kBlue);
  hist -> Draw("violiny(12000000)");
}

