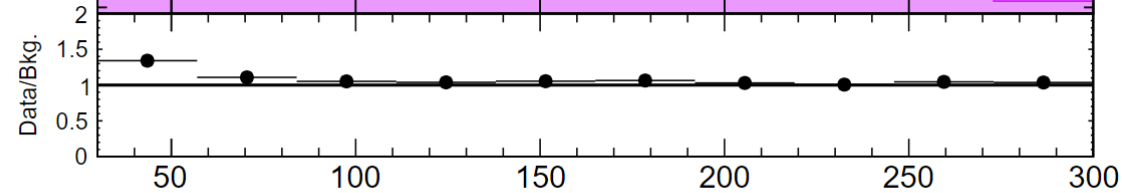
i plotted the ratio of Data and MC as shown in fig. i want to draw vertical error bars in ratio plot. can somenoe help how to do that.
im using lxplus
ROOT 6.28/04
Thanks
Do you have a small macro reproducing this issue ?
its a large framework which produce this plot but the ratio part is"
    ratio = data.Clone('ratio')
    ratio.Divide(added_bkg)
    ratio.GetXaxis().SetMoreLogLabels(kTRUE)
    ratio.GetXaxis().SetNoExponent(kTRUE)
    pad = TPad("pad", "pad", 0.0, 0.0, 1.0, 1.0)
    pad.SetTopMargin(0.7)
    pad.SetRightMargin(0.03)
    pad.SetFillColor(0)
    pad.SetGridy(0)
    pad.SetFillStyle(0)
    pad.Draw()
    pad.cd(0)

    ratio.GetXaxis().SetTitleSize(0.04)
    ratio.GetXaxis().SetTitleOffset(1.3)
    ratio.GetYaxis().SetTitleSize(0.03)
    ratio.GetYaxis().SetTitleOffset(1.2)
    ratio.GetYaxis().SetTitle("Data/Bkg.")
    ratio.GetYaxis().CenterTitle()
    ratio.GetYaxis().SetLabelSize(0.03)
    ratio.GetYaxis().SetNdivisions(505)
    ratio.SetMarkerStyle(20)
    ratio.SetMarkerSize(1.2)
    ratio.SetLineColor(1)
    ratio.SetMarkerColor(1)
    ratio.SetMinimum(0)
    ratio.SetMaximum(2.0)
    ratio.Draw("lep")
    c1.Modified()
    c1.Update()
So ratio is a TH1 ?
yes, TH1
You draw it with option E so it should show the errrors. May be they are very small and hidden by the markers. Try with option “E” only instaed of “LEP”.