I have a dataset where I am fitting the following function.
Model = f . [ fs . sig1(x) + (1-fs) sig2(x) ] + (1-f) bkg(x)
I am fitting using Model->fitTo(dataset), which fits the data based on max log likelihood fit (as per my knowledge).
I want to obtain the ‘fs’ from the fit. Now, how can I verify that this ‘fs’ fraction OR with how much confidence I can say that this value is correct? To observe the quality of fit I can look at the chi2/ndf, but is there any other way on which I can rely and be confident on the results I get?
just get the error of the parameter. You should automatically get errors from the HESSE algorithm, which usually gives a good approximation. If you used fitTo(dataset, RooFit::Minos()), you will get even better errors.
And look at the output of the fitter. The fits shouldn’t fail, obviously. Status 0 means that all is fine.
Thanks Stephan,
In my case I get errors from HESSE and it is around 0.2 +/- 0.01 (fs). Actually, I always get small errors, that’s why I was suspicious regarding my fits.
One more thing I want to mention about the fitting components (pdfs), I draw them on the frame like this -
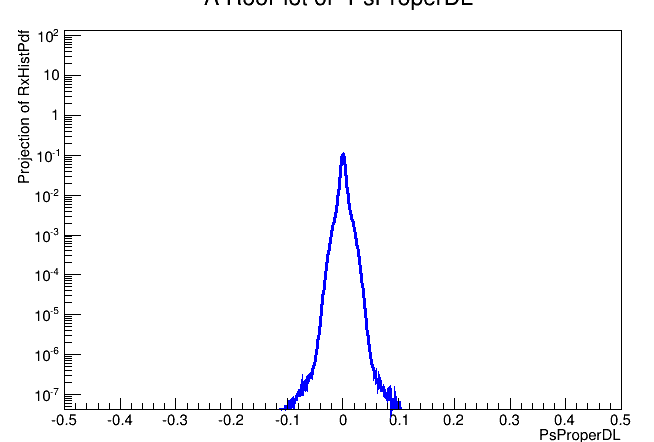
I always get the first two pdfs on the frame but never the last one i.e. RxHistPdf. Even if I draw only this one I do never get it on the frame, there are no errors. This pdf is placed where you see sig2(x) in my Model formula.
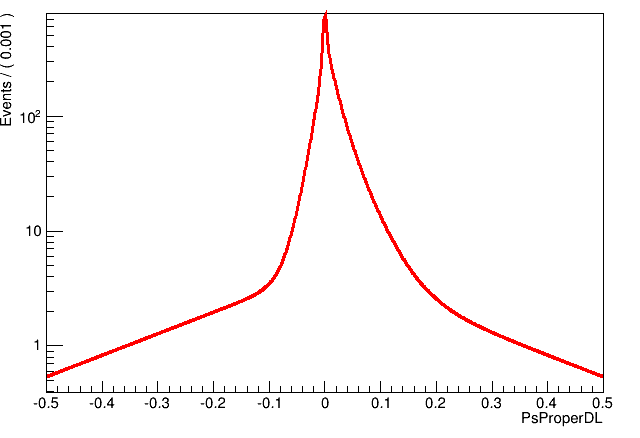
When I draw the component R(x) using above sets of command I get R(x) and Fbkg(x) overlayed perfectly, But R(x) has totally different shape than FBkg(x).
If I plot R(x) alone (not as a component of ‘Model’) it looks like this (Blue), otherwise if plotted as component of Model then both are overlayed (Red).
Could you please suggest what could be the reason? Or please ask if I raise confusion in my text.