Dear All,
I am doing some graphs, however I would like to change the range on the X axis like the one I attached.
Can someone tell me how to do it please ? I would really appreciate.

Thanks in advance.
Cheers
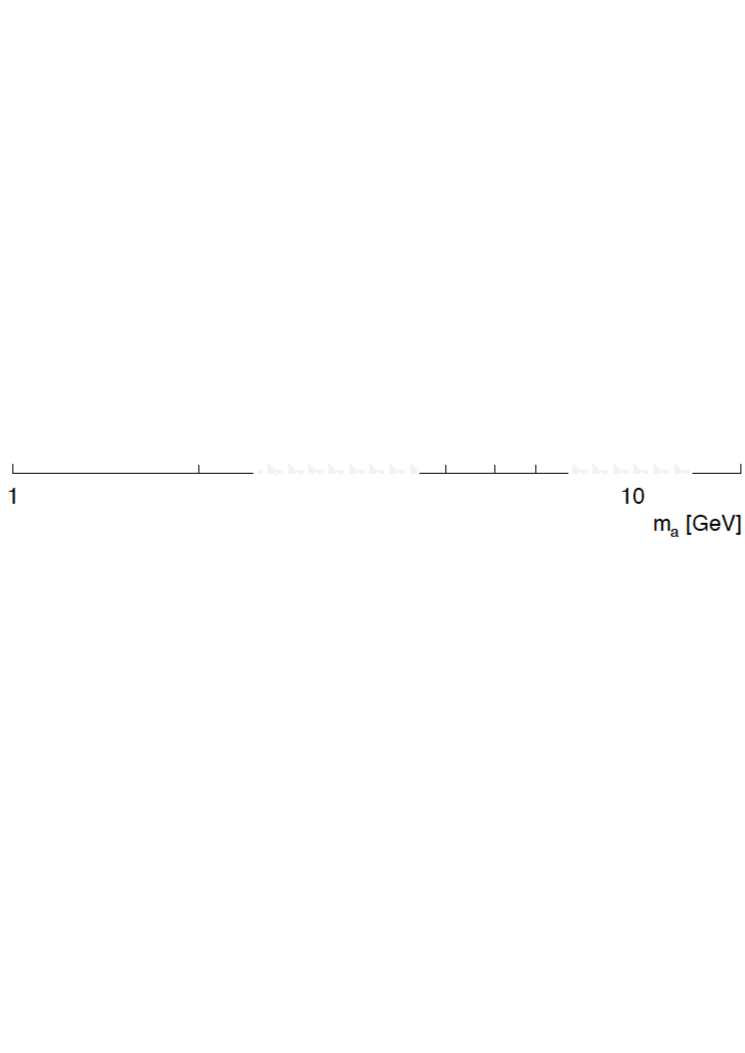
It looks like a log scale… is it the case ?
if you do not know what kind of scale it will be difficult to help you. Any way for graphs you can be linear or log. Any other scale will be tricky to do, not impossible, but tricky … But at least we should know what kind of scale it is … Also a small macro example will help.
Maybe you are missing: TAxis::SetMoreLogLabels
See, for example:
${ROOTSYS}/tutorials/hist/logscales.C
${ROOTSYS}/tutorials/graphs/exclusiongraph2.C
Hi,
Thanks very much that was really what I needed, maybe I was not so clear. It works now.
Cheers,
Diallo