Hi Rooters,
sorry for disturbing. I have some problem translating CPP to Python, moreover I cannot find pyroot tutorials much useful for my problem, neighter in other forum’s posts. So, my problem is that I would like to use the TPaveStats class to create a box with statistics and moving it where I want. At the moment I just used the gstyle method and yes, it works but it covers part of the plot.
Here is the code:
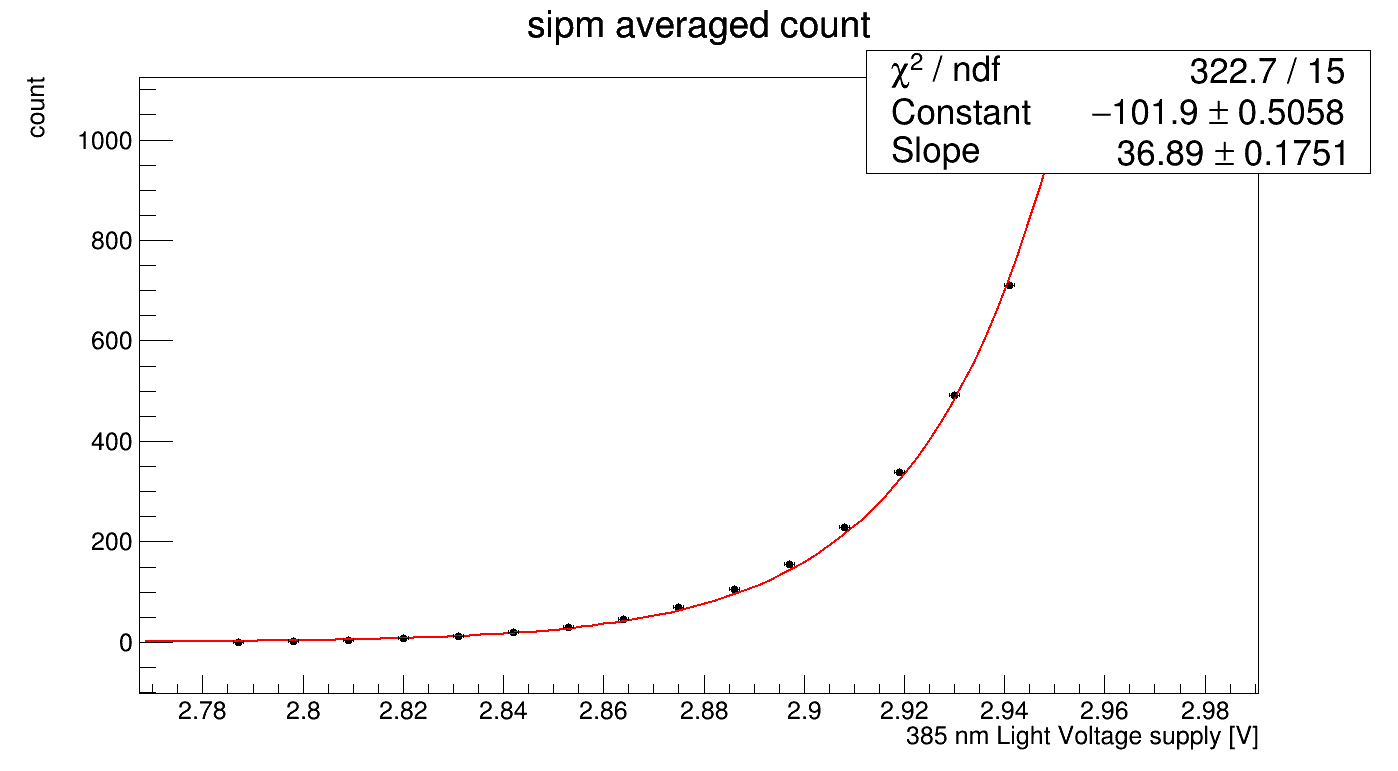
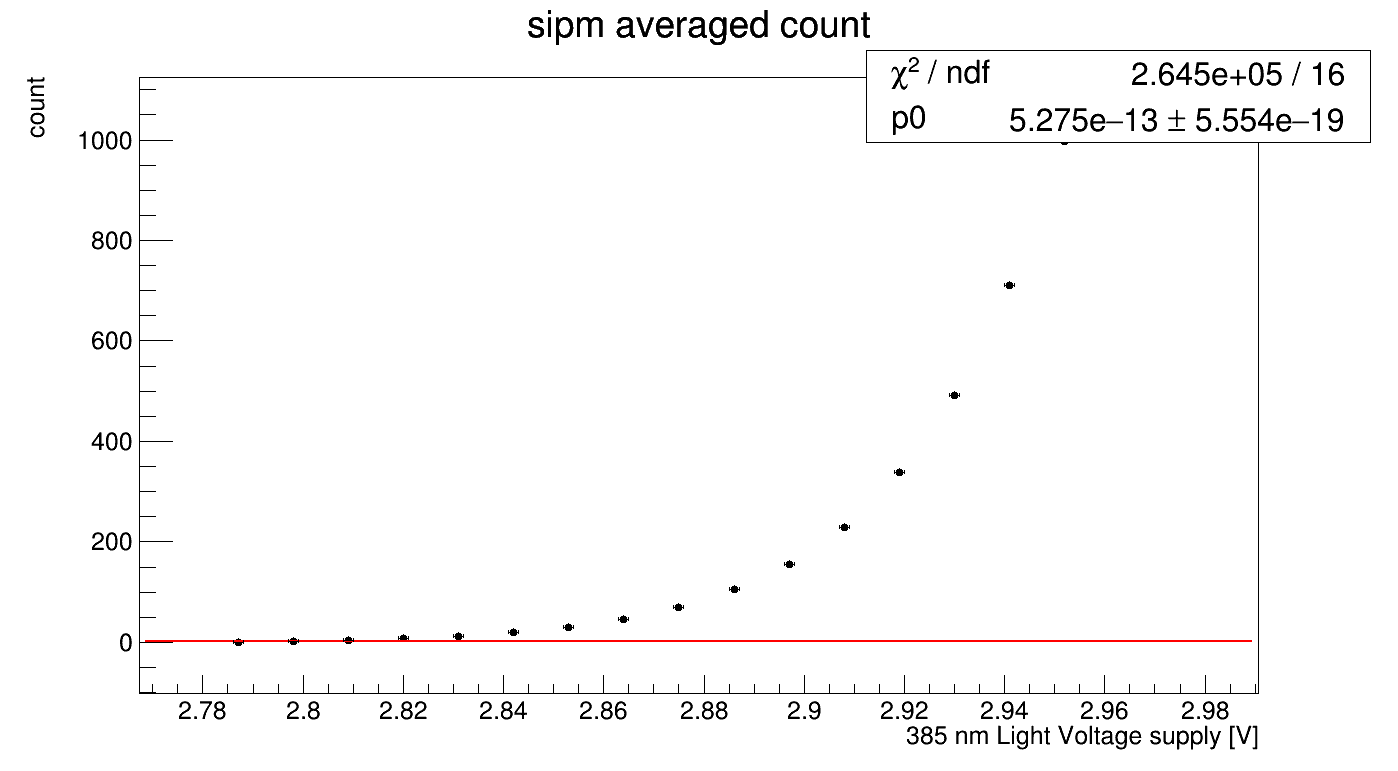
func = ROOT.TF1('func', 'exp([0]*x)',0, np.amax(mean_s))


g = TGraphErrors(index, volt,  mean_s, x_err, std_s)
g.SetName('sipm averaged count')
g.SetTitle('sipm averaged count')
g.SetMarkerStyle(8)
g.SetMarkerColor(1)
g.GetYaxis().SetTitle("count");
g.GetXaxis().SetTitle("385 nm Light Voltage supply [V]");
g.Fit('expo')
#g.Fit('pol2', "EX0")
gStyle.SetOptFit(1)
g.Draw("AP")
c1.SaveAs(pdffile)
As you could see I also tried to simply make a custom exponential function but i failed as the fit…well, doesn’t fit.
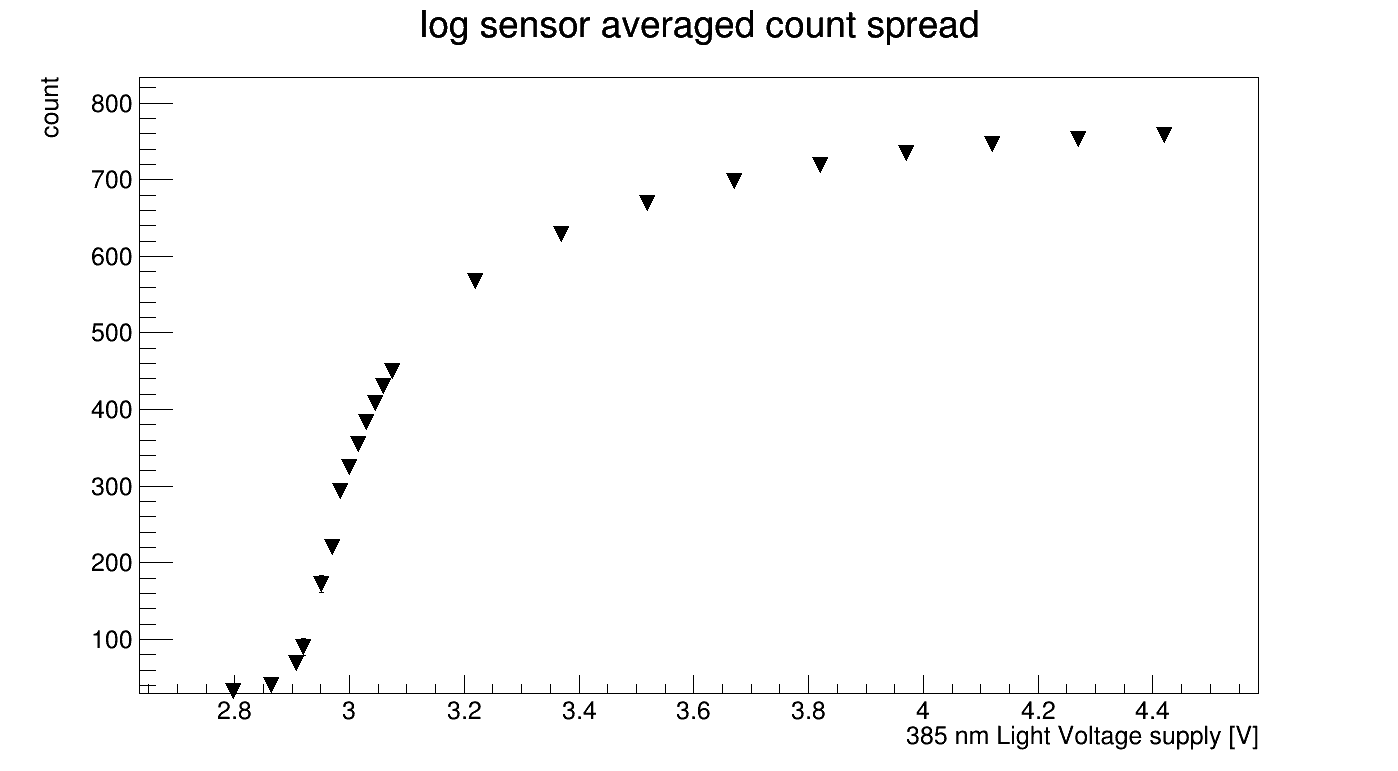
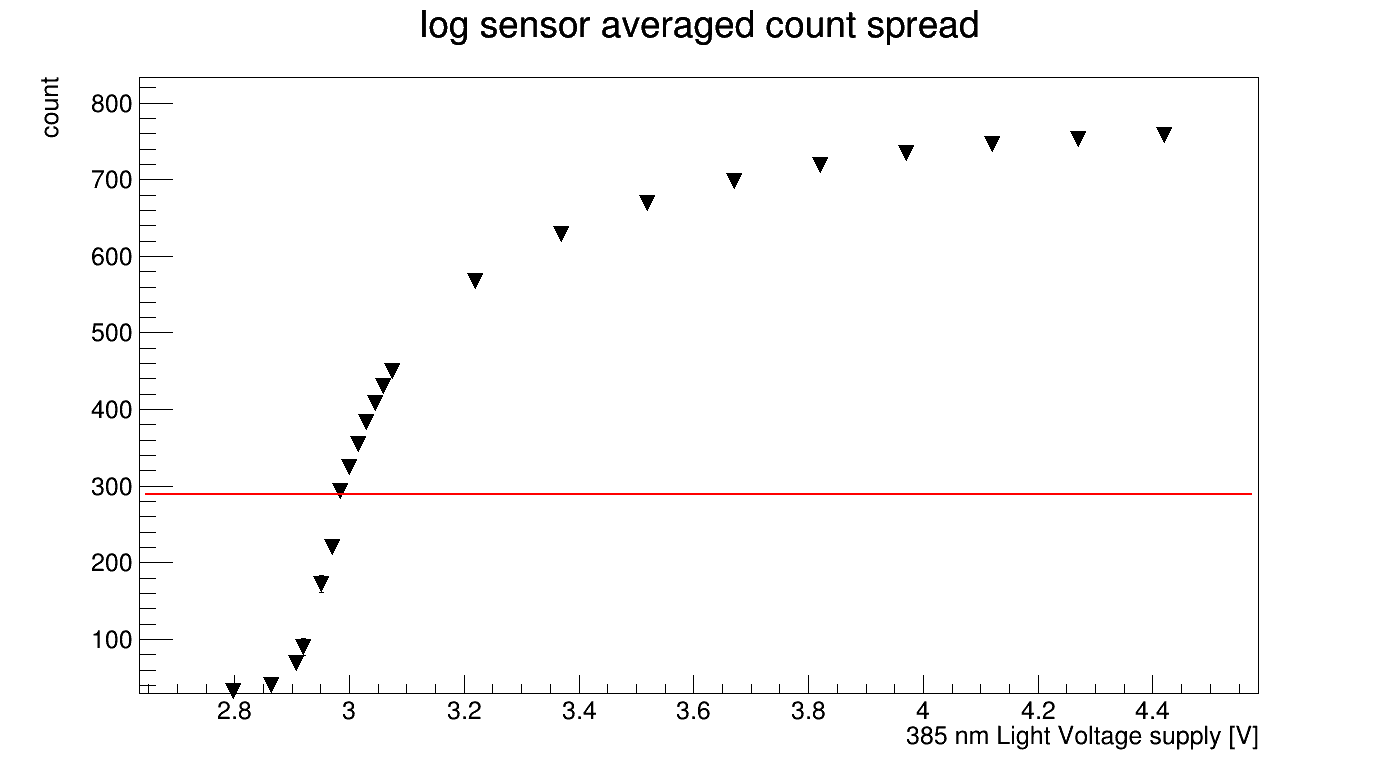
I will attach some plot just to show.
I think I don’t have to explain which images is showing what…
Anyway, so, please, help me:
a) Using TPaveStats or Text to move the box elsewhere (maybe also adding the complete fitting function exp(p0+p1*x))
b) Understand why my custom function is not working
Thanks in advance!
_ROOT Version: 6.20.04
Platform: Ubuntu 16.04
Compiler: gcc 5.4.0