I’m trying to make a graph with different data sets and 2 different y axis scales. The first data set will use the first scale (which I want displayed on the left), and all the rest of the data sets will use the second scale (which should appear at the right). I am using TMultiGraph and I am very confused. The code I have displays both scales at the left and the right and puts all graphs on the second scale, so that I can’t even see the first data set. Here is the code I have:
Thanks for the reply. I have seen that example elsewhere and I tried to modify it to meet my needs but it doesn’t seem to work with TGraph. Is there any way I can do it with TMultiGraph or even TGraph? Thanks.
I also want to draw some data with TMultiGraph. In the end it also should have two different y-axis.
My first step was the try to draw the y-axis at the right side with Draw(“LPAY+”). But it seems to me as if TMultiGraph ignores the drawing option “Y+” . Here I made a simple example:
{
double x[5] = {1,2,3,4,5};
double y[5] = {3,4,2,3,4};

TCanvas *c1 = new TCanvas("c1", "c1");

TGraph *gr = new TGraph(5,x,y);
TMultiGraph *mg  = new TMultiGraph();

mg->Add(gr, "LPY+");
mg->Draw("LPAY+");
}
I run your program “multig2.C”. If I understood it correctly, it was meant to set the boolean drawMultiGraphs from false to true, for the case I want to have it drawn with MultiGraphs. But if I do this, the result is the same, as before…the right axis is still on the left.
Can you help me?
Yes … Y+ is ignored… on workaround could be to draw a frame first using Y+ and draw the multigraph on top but you will lose the automatic scaling over the graph collection:
{
double x[5] = {1,2,3,4,5};
double y[5] = {3,4,2,3,4};

TCanvas *c1 = new TCanvas("c1", "c1");

TGraph *gr = new TGraph(5,x,y);
gr->Draw("APY+");

TMultiGraph *mg  = new TMultiGraph();

mg->Add(gr, "L");
mg->Draw();
}
Sorry for answering so late but I was working on a different solution.
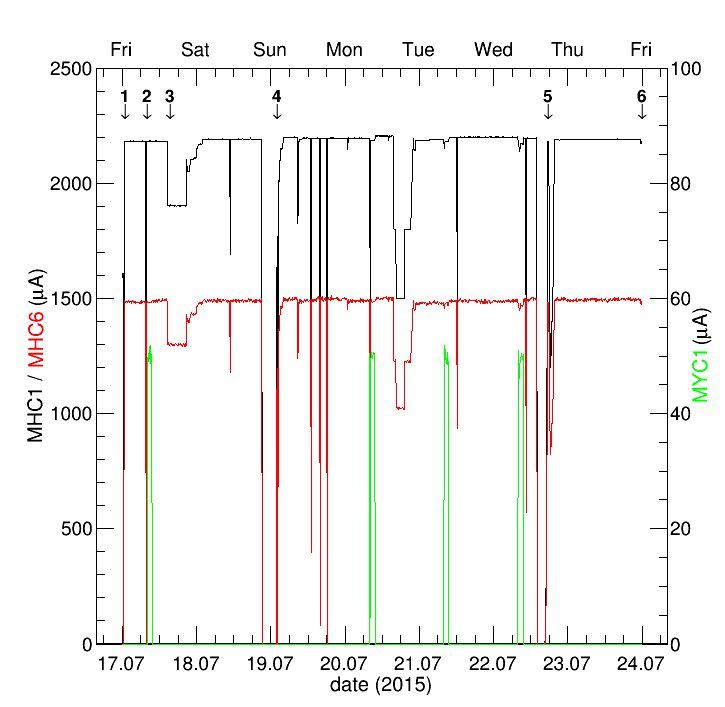
Actually, I wanted to create two pads with two multigraphs. One with two line graphs and the axes on the left and bottom respectively. The other graph should have a different y-scale, a line and a scatter graph (like in the picture). Since I needed custom markers (numbers like in the pic) I chose to use TLatex-text I just added to the pad with the respective xy coordinates.
In the beginning I tried something like this (very short version of what I remember what I tried):
	MHC1 = new TGraph(n,date,currentMHC4);
	MHC6 = new TGraph(n,date,currentMHC6);
	MYC1 = new TGraph(n,date,currentMYC1);
	SCATTER = new TGraph(n,date,nPOINTS);

	mg  = new TMultiGraph();
	mg2  = new TMultiGraph();
	pad1 = new TPad("pad1","",0.03,0,0.73,1);
	pad2 = new TPad("pad2","",0,0,1,1);
	pad1->Draw();
	pad1->cd();
	mg->Add(MHC1,"LPY");
	mg->Add(MHC6,"LP");
	mg->Draw("ALP");

	pad2->Draw();
	pad2->cd();
	mg2->Add(MYC1,"LPAY+X++");
	mg2->Add(SCATTER,"LPAY+X+");
	mg2->->Draw("LPAY+X+");
I also tried different combinations of “LAPYX+” aso.
The next question would have been wether there is the possibility of custom markers.