Hi all,
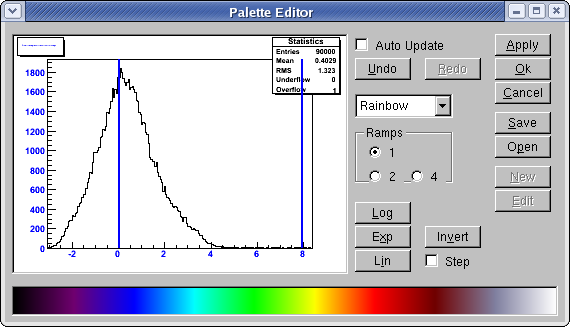
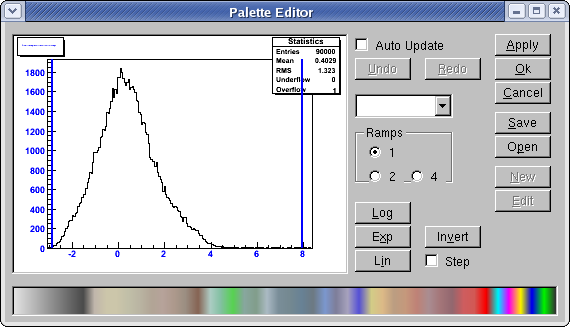
Can someone tell me how to use a modified “Rainbow” TImagePalette for TH2 histograms drawn with “colz”? I am able to read in a palette root file that I saved through the palette editor from the state shown in palette.png (note also the lower bound is moved up), but when I grab the palette from the root file and use it on a histogram, I end up with the the default palette (same as in palette_default.png).
Here’s a snippet of code showing how I read the palette (assume h2f is a TH2F histogram that is already filled):
TFile *f1 = new TFile("image.pal.root","READ");
TImagePalette *ip = (TImagePalette *)f1->Get("TImagePalette");
delete f1;

Int_t *in = ip->GetRootColors();
gStyle->SetPalette(0,in);
h2f->Draw("colz");
If I read the palette in correctly, then I need guidance on how to apply it because the latter part of the code certainly doesn’t seem to work.
Thanks,
Curtis