hubhub
March 15, 2016, 2:11pm
1
dear all
I use a multigraph to plot data, each data is a one day representation. I tried to use SetTimeFormat function to show my data with time but I did not pass.
mg->GetXaxis()->SetTimeDisplay(1);
Best regards
hubhub
couet
March 15, 2016, 2:46pm
2
Can you provide a small script showing what “did not pass” ?
hubhub
March 15, 2016, 3:06pm
3
Yes of course!
 const Int_t n = nbLignes;
 in.open("scores.txt");
 Double_t  x[n], data[n];
 Int_t  i(0);
 while (1) {

         in >> data[i] ;
         if (!in.good()) break;
         x[i] = i;
         i++;

 }
in.close();


TMultiGraph *mg = new TMultiGraph();
TGraph *gr=new TGraph(n,x,data);
mg->Add(gr);
mg->Draw("ap");
mg->GetXaxis()->SetTimeDisplay(1);
mg->GetXaxis()->SetTimeFormat("%H %d %F2016-03-24 04:30:00");
couet
March 15, 2016, 3:20pm
4
can you send a script we can execute ?
hubhub
March 16, 2016, 9:42am
5
yes, here it is !
#include <time.h>
#include "TStyle.h"
#include "Riostream.h"
#include "TGraph.h"
#include "TCanvas.h"
#include "TArrow.h"
#include "TPaveLabel.h"
#include "TGaxis.h"
#include "TPad.h"
#include "TAxis.h"
#include "TLine.h"
#include "TPaveLabel.h"
#include "TEllipse.h"
#include "TText.h"
#include "TMultiGraph.h"
#include "TPaveText.h"
#include "TDatime.h"
#include "TH1F.h"
#include "TGaxis.h"

using namespace std;

int graphAnalyse()
{

 TCanvas *c1 = new TCanvas("c1","c1", 10,10,2000,1600);
 c1->SetGridx();
 c1->SetGridy();
 ifstream in;
 in.open("scores.txt");
 Int_t nbLignes(0);
 string ligne;
 if (in)
 {
	while(getline(in, ligne))
	{
		if (ligne[0] == '#') continue;
		nbLignes++;
	}
 in.close();
 }
 else
 {
	cout << " le fichier n'existe pas " << endl;
 }
 cout << " le nombre de lignes du fichier est " << nbLignes << endl;
 /////////////////////////////////////////////////////////////////////
 const Int_t n = nbLignes;

 in.open("scores.txt");
 Double_t  x[n], data[n];
 Int_t  i(0);
 while (1) {

	 in >> data[i] ;
	 if (!in.good()) break;
	  x[i] = i;
	 i++;

 }
in.close();


TMultiGraph *mg = new TMultiGraph();
TGraph *gr=new TGraph(n,x,data);
gr->SetMarkerStyle(kFullCircle);
mg->Add(gr);
mg->SetMaximum(1000);
mg->SetMinimum(0);
mg->Draw("ap");
mg->GetXaxis()->SetTimeDisplay(1);
mg->GetXaxis()->SetTimeFormat("%H %d %F2016-03-24 04:30:00");

gPad->Modified();

return 0;
}
and the score.txt file is
207
295
367
436
485
494
658
1407
766
763
807
785
786
couet
March 16, 2016, 9:54am
6
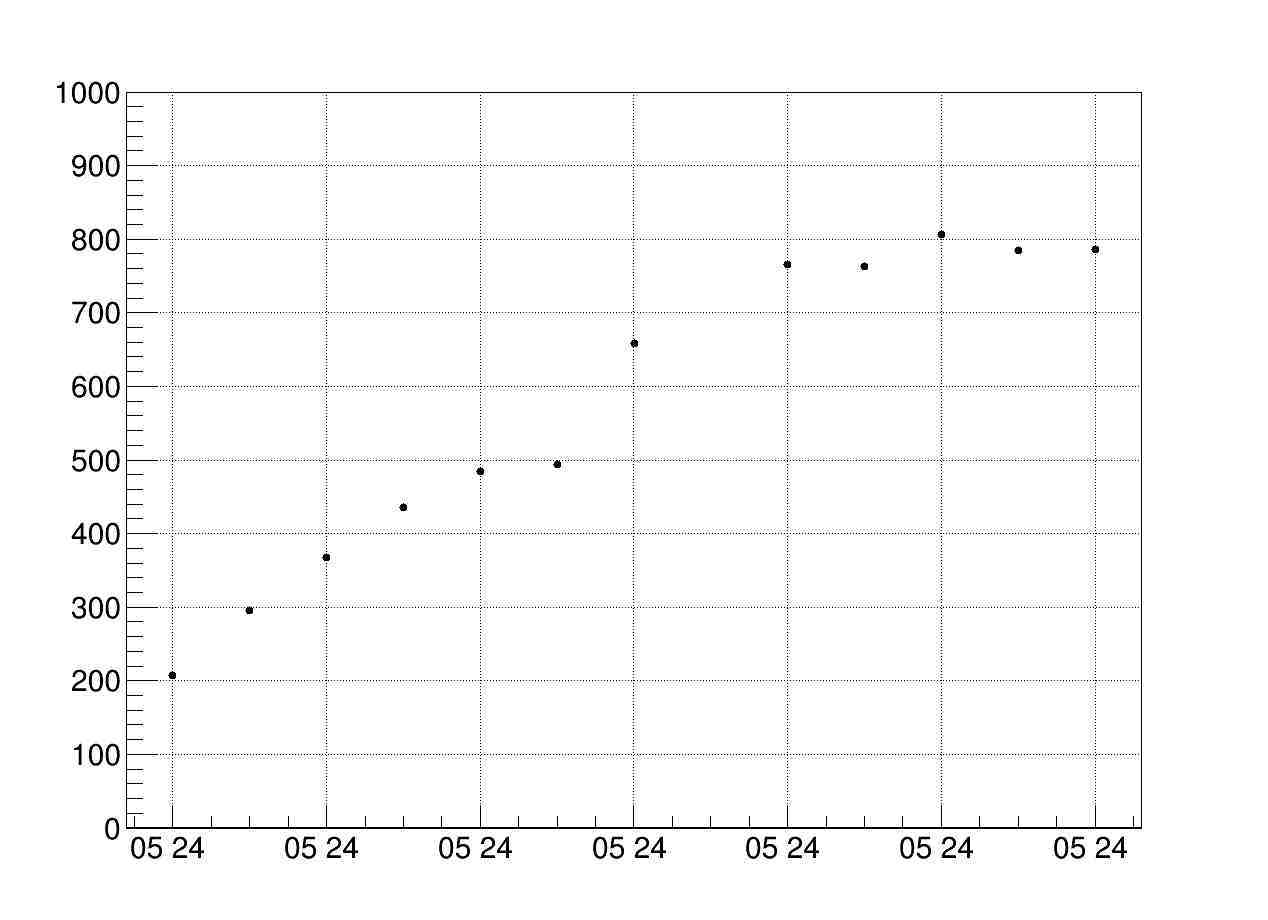
For me it works. You asked to see the hour and day and that’s what you see…
hubhub
March 16, 2016, 10:03am
7
yes, but each data is for one day so I would like to see for example
couet
March 16, 2016, 10:21am
8
You x value are not date. Look root.cern.ch/how/how-create-axis-time-units
hubhub
March 16, 2016, 3:26pm
9
thank it works if I declare each x as time like this
couet
March 21, 2016, 2:02pm
10
but I would like to do a loop.  :mrgreen:
Is it possible ?
Yes … just do it … what is the problem ?