I’ve tried to implement a macro to draw a TH3 histogram displaying the bins of different colours according to the content. I’ve followed the example in $ROOTSYS/tutorials/gl/glvox2.C, and used the transfer function.
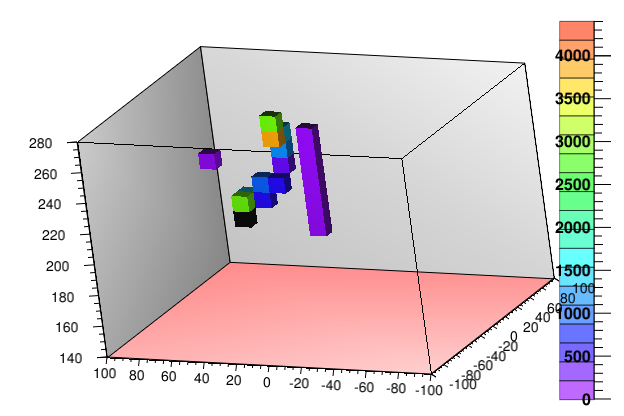
It does work as far as the display of the bins with content, but the colours don’t really reflect the palette and, moreover, the bins change colour when I pass the mouse on them. In particular, the bin with maximum content is shown as black, oppositely to the palette, where the highest value is red. Is there a way of solving this?
I attach the file with the TH3 histogram and the ROOT macro with the transfer function.
Yes, exactly. The odd thing is that the bin with highest content is always displayed as black. Why is that?
In the example I attached it should be red, right?
This returns fPaletteSize for z = fZRange.second but it should be fPaletteSize-1.
So something like this should be added (and const removed from const Int_t ind).
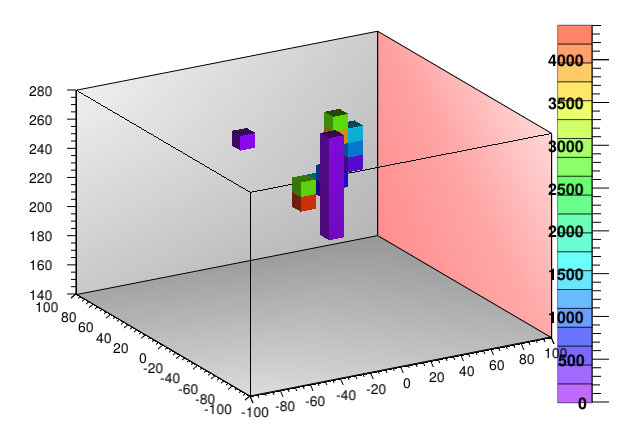
With your fix I get the attached picture. It looks fine.
I cannot commit now because we are in the release process.
Next week …[/quote]
Olivier, either commit this:
if (z - fZRange.first < 0.)
   z = fZRange.first;
else if (fZRange.second  < z)
   z = fZRange.second;

UInt_t ind = UInt_t((z - fZRange.first) / (fZRange.second - fZRange.first)) * fPaletteSize;
if (ind >= fPaletteSize)
	ind = fPaletteSize - 1;
now that the obvious problem with “glcol” is (will be) solved I come to another issue:
Looking at Oliviers plot (the same of course happens for me) one can see that
the colors in the plot and the palette (z-scale) are not really the same.
Especially the “red” is much fainter in the palette.
It looks as if the palette has a “transparency” of about 0.8
With your fix I get the attached picture. It looks fine.
I cannot commit now because we are in the release process.
Next week …[/quote]
Olivier, either commit this:
if (z - fZRange.first < 0.)
   z = fZRange.first;
else if (fZRange.second  < z)
   z = fZRange.second;

UInt_t ind = UInt_t((z - fZRange.first) / (fZRange.second - fZRange.first)) * fPaletteSize;
if (ind >= fPaletteSize)
	ind = fPaletteSize - 1;
What does exactly this last change produces?
And, for what concerns the transparency, I was also puzzled that the palette didn’t represent the actual colors in the plot. Shouldn’t they have the same transparency?
[quote=“paolafer”]
And, for what concerns the transparency, I was also puzzled that the palette didn’t represent the actual colors in the plot. Shouldn’t they have the same transparency?[/quote]
Plot with OpenGL can occupy the whole canvas (that never happens with any non-gl 3D plot) - because of zoom feature. The palette is transparent not to obscure any details in a plot below. Anyway, 3d plots are using GL lighting model and palette is in a flat 2D mode (without lighting) so like it or not, they WILL NEVER be the same colors.