Hi,Everyone,below is my question:
I have the results_combined.root, the content is:
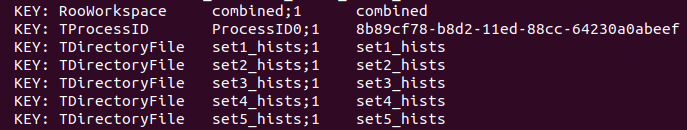
And combined->Print(), some message as belows:
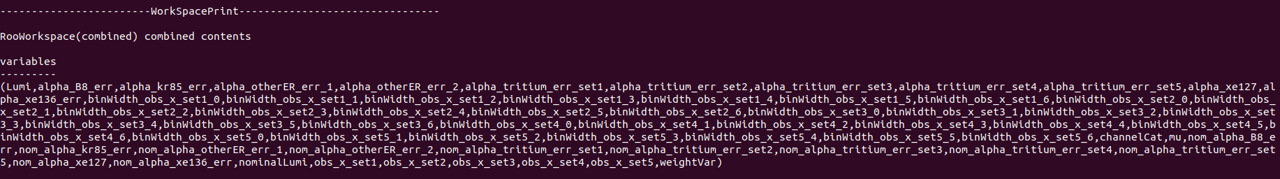
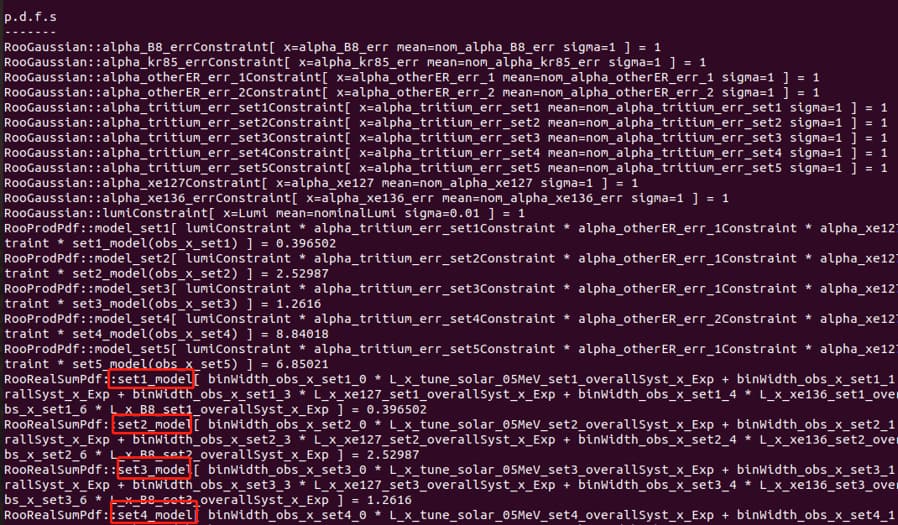
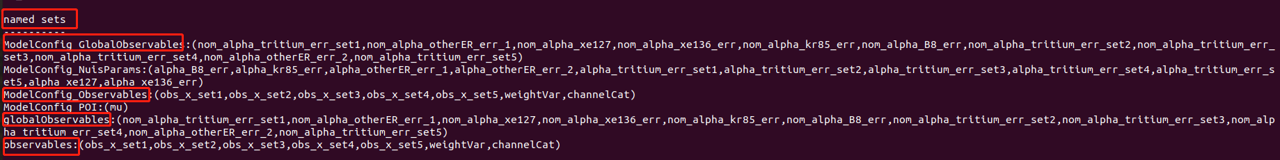
Above is the total information of the combined root file; Then I ues the root fit to do fit for the different set data and want to plot the post fit result (include the signal and bkg all like the globalObservable),but now I just get the below graph.
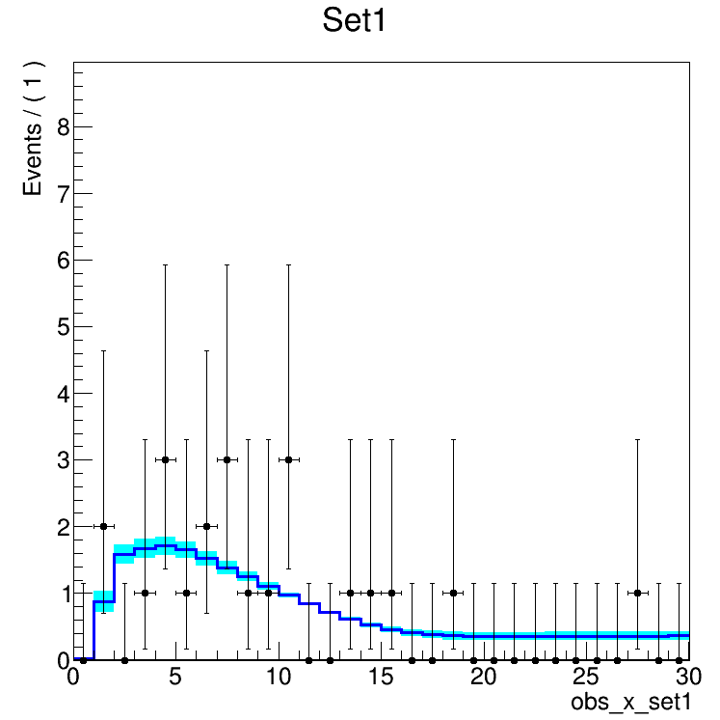
How to plot fitresults (sig and bkg(all)) together such as set1_data and the bkg belong to set1.
here is the input root file:
results_combined.root (134.2 KB)
here is the macro file I used:
PlotTest.C (5.2 KB)
Looking forward to your reply, thank you very mach!