Hi @David_Vannerom,
okay, thanks for confirming this! Okay, so there is no differential observable in your measurement then. RooStats still needs at least one observable to work properly though.
Maybe what you can do is to create two extended RooUniforms for signal and background, and the expected number of signal events depends depends on your mass parameter that you get from your histogram? You can then do the upper limit extraction for each mass value in your histogram, save the results of the HypoTestInverter and plot them.
I have quickly hacked together a standalone example to explain what I mean:
compute_limits_example.py (3.8 KB)
The output of this example should look like that:
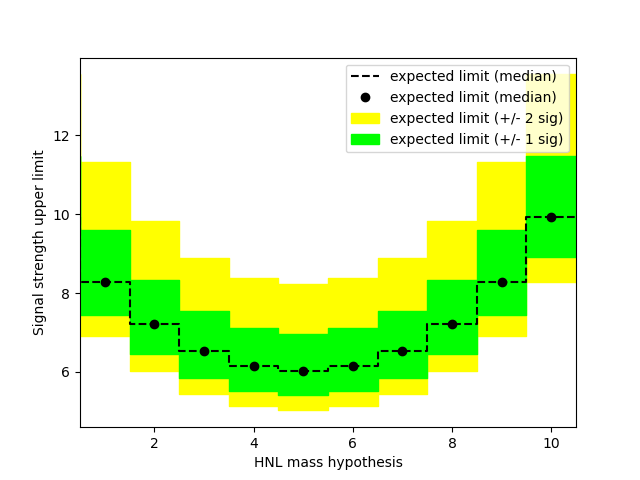
It’s just an example, so I guess from the physics point of view it doesn’t make sense that the highest predicted cross section and hence sensitivity is for this arbitrary value of 5.0 
I hope this code example gives you some inspiration to solve also your problem! In any case, feel free to continue asking questions.
Cheers,
Jonas