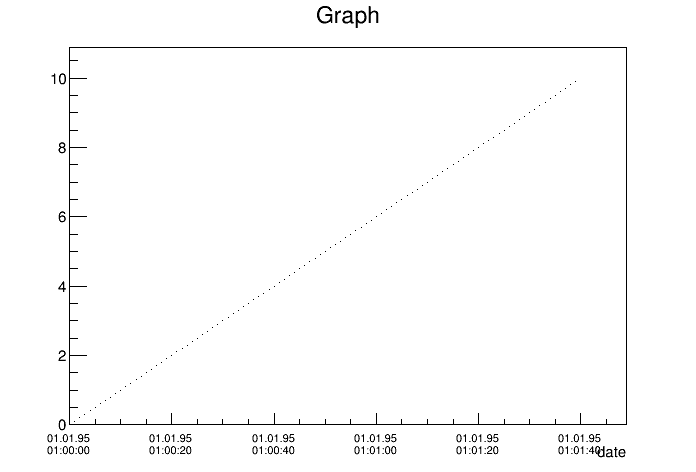
This used to give me nice lables in the following form:
16.12.13
11:02:03
Now I realized, that when I’m zooming in to the x axis, at a certain zoom level, I start getting labels like this:
16.12.13
11:02:03s05189
This behaviour is unwanted. I did not find any hint in the documention to avoid this.
Currently I’m using ROOT 5.34/13 (v5-34-13@v5-34-13, Dec 01 2013, 12:01:56 on win32). I did a update recently updating from 5.34/07, and I believe that I did not have this issue there. Unfortunately, I can’t go back easily to verify.
You need to go below the sec as you zoom otherwise you will have several tick with the same label.
for me that’s correct … the plot you sent is correct seems to me …
Well, I don’t believe this should be the intended behaviour.
When I change the time format to “#splitline{%d.%m.%y}{%H:%M}” in the example to omit the seconds, ROOT has not any problems at all to have several ticks with same label. Also then I can zoom in to maximum, without magically seconds or subseconds to appear.
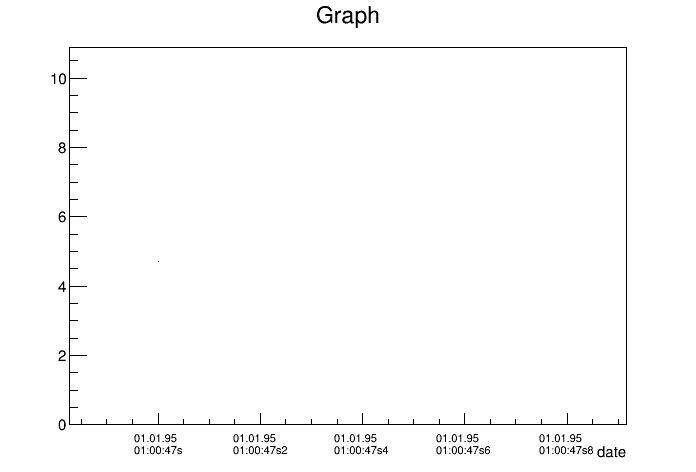
And even if this behaviour for some reasons should be intended and is meant not to be influenced by SetTimeFormat: Shouldn’t the subseconds be printed out properly at least? In the attachment above you see, that if the subseconds are 0, the label is not “01:00:47s0”, as one might then expect, but “01:00:47s” without the trailing 0.
Also, in my real script, it’s not only one digit behind, but 5. I was not able to reproduce this with a simple script, but I attached an example picture. Apart from that, my script (written in Python) behaves exactly like the strip-down example above.