Hi,
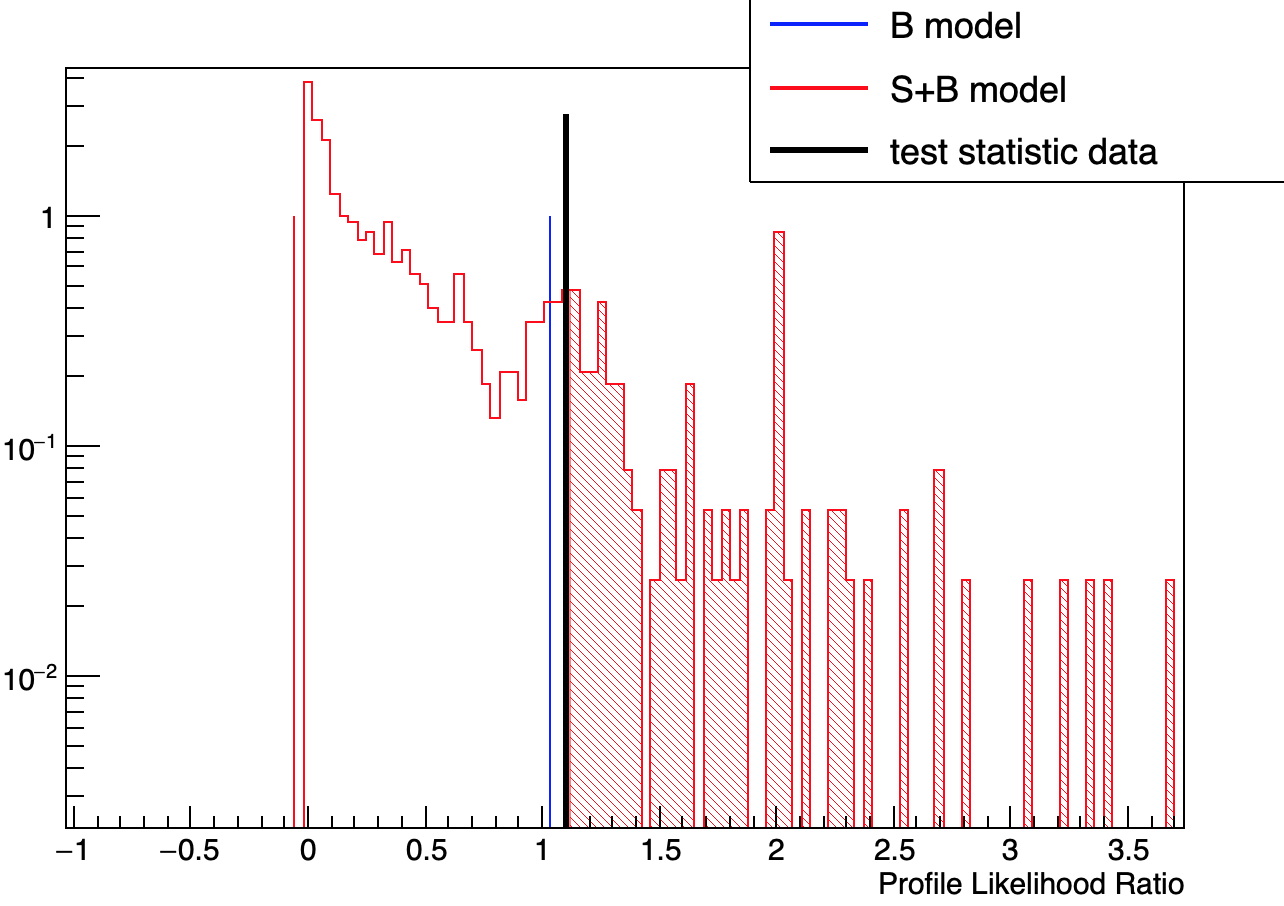
We set a simple counting experiment to test N_sig =1 with N_bkg = 1.48 (err = 30%) and the N_obs=1. With 1000 toy data generated with S+B, we have poisson discrete distributions for the N_toydata. However, the output profilelikelihood calculator (pll) gives continuous distributions, which is out of expectation. For instance, we expect that pll for N_toydata=1 should be always the same and the pll distribution should be discrete. Do you know what the fitting is actually performed in this counting experiment? Thank you!
Best,
Ning
The code is as below
  TFile *file = TFile::Open("CountingModel.root");
  RooWorkspace *w = (RooWorkspace *)file->Get("w");
  ModelConfig *sbModel = (ModelConfig *)w->obj("ModelConfig");
  sbModel->SetName("S+B model");
  RooAbsData *data = w->data("data");
  ModelConfig *bModel = (ModelConfig *)w->obj("");
  if (!bModel) {
    bModel = (ModelConfig *)sbModel->Clone();
    bModel->SetName("B model");
    RooRealVar *var = dynamic_cast<RooRealVar *>(bModel->GetParametersOfInterest()->first());
    if (!var)
      return;
    double oldval = var->getVal();
    var->setVal(0);
    bModel->SetSnapshot(RooArgSet(*var));
    var->setVal(oldval);
  }

  FrequentistCalculator fc(*data, *bModel, *sbModel);
  HypoTestInverter calc(fc);
  calc.SetConfidenceLevel(0.9);
  calc.SetVerbose(true);

  // configure ToyMCSampler and set the test statistics
  ToyMCSampler *toymcs = (ToyMCSampler*)fc.GetTestStatSampler();
  toymcs->SetNEventsPerToy(data->numEntries());
  ProfileLikelihoodTestStat profll(*sbModel->GetPdf());
  // for CLs (bounded intervals) use one-sided profile likelihood
  profll.SetOneSided(false);
  toymcs->SetTestStatistic(&profll);

  fc.SetToys(1000,1);

  int n_point = 2;
  double lower_bound = 1;
  double upper_bound = 5;
  calc.SetFixedScan(n_point, lower_bound, upper_bound);
  HypoTestInverterResult * r = calc.GetInterval();
  HypoTestInverterPlot *plot = new HypoTestInverterPlot("hi","",r);
  int ts_idx = 1;
  SamplingDistPlot *pl = plot->MakeTestStatPlot(ts_idx);
  pl->SetLogYaxis(true);
  pl->Draw();