Hello, I have a script where I draw several histograms onto the same pad with the “same” option. I have noticed that if I GetXaxis()->SetRangeUser() on the first TH1 only, the subsequent histogram will display bin contents incorrectly.
I have uploaded a simple script to replicate the problem. There are a few extra variables, but essentially a histogram is populated by a function (the function does not matter, don’t worry about it). And you can set option = 1 for incorrect display behavior or option = 2 for correct display behavior. The difference is only if SetRangeUser() is called on the first histogram only or also on the second histogram.
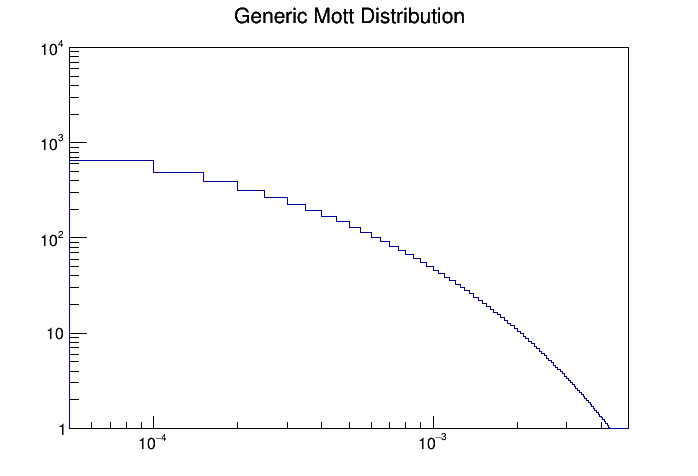
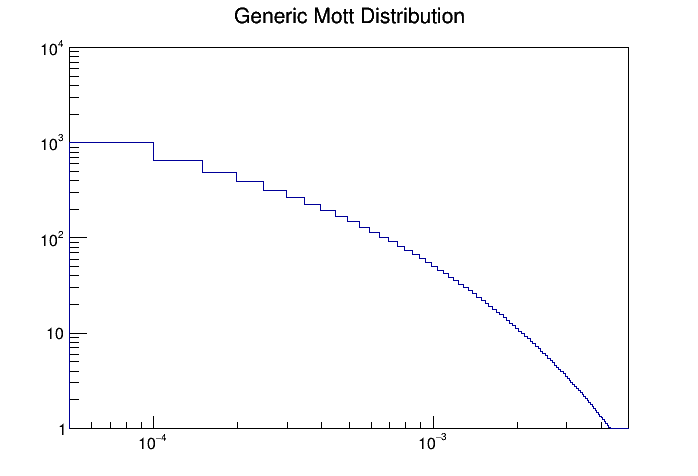
The histograms are binned identically, the first bin is from 0 to 5e-5. The second bin is 5e-5 to 1e-4.
The first bin’s value is 995, the second bin’s value is 656.
SetRangeUser() is used to cut off the display of the first bin, so the first bin displayed should be the second bin, with a value of 656.
It seems like an oversight to me that using SetRangeUser on the first histogram results in incorrect display of a subsequent histogram drawn with “same”.
void testProblem(){
   int nb   = 100;
   float x2 = 0.005;
   float x1 = 0;

   auto h1 = new TH1F("h1","h1",nb,x1,x2);
   h1->GetXaxis()->SetNdivisions(5);
   h1->GetXaxis()->SetRangeUser(5e-5,x2);
   h1->SetMaximum(1100);

   auto h2 = new TH1F("h2","h2",nb,x1,x2);
   h2->GetXaxis()->SetNdivisions(5);
   h2->SetFillColor(1002);

   gStyle->SetOptStat(0);
   for (int j = 1; j <= nb; j++) {
      float     w = 200-j;
      if (j==1) w = 1000.;
      if (j==2) w = 600.;
      if (j<3) cout << "bin # = " << j << ", value = " << w <<  endl;
      h2->SetBinContent(j, w );
   }

    auto c1 = new TCanvas;
    c1->Divide(3,1);
    c1->SetLogx();

   // to make it work uncomment the next line
//   h2->GetXaxis()->SetRangeUser(5e-5,x2);

   c1->cd(1)->SetLogx();
   h1->Draw();
   h2->Draw("same");

   c1->cd(2);
   h1->Draw();
   h2->Draw("same");

   c1->cd(3);
   h2->Draw();
}
The first plot is wrong. The first bin should be 600 like the second plot.
It has to do with the bin width. See this other version.
void testProblem(){
   int nb   = 26; // 25 is ok
   float x2 = 0.005;
   float x1 = 0;

   auto h1 = new TH1F("h1","h1",nb,x1,x2);
   double xr1 = h1->GetXaxis()->GetBinLowEdge(2);
   h1->GetXaxis()->SetNdivisions(5);
   h1->GetXaxis()->SetRangeUser(xr1,x2);
   h1->SetMaximum(1100);

   auto h2 = new TH1F("h2","h2",nb,x1,x2);
   h2->GetXaxis()->SetNdivisions(5);
   h2->SetFillColor(1002);

   gStyle->SetOptStat(0);
   for (int j = 1; j <= nb; j++) {
      float     w = 200-j;
      if (j==1) w = 1000.;
      if (j==2) w = 600.;
      if (j<3) cout << "bin # = " << j << ", value = " << w <<  endl;
      h2->SetBinContent(j, w );
   }

   auto c1 = new TCanvas;
   c1->Divide(2,1);

   c1->cd(1)->SetLogx();
   h1->Draw();
   h2->Draw("same");

   c1->cd(2);
   h1->Draw();
   h2->Draw("same");
}
if the number of bins is 25 the plot is ok, 26 is wrong. I guess there is some rounding issue in the case of the logarithmic scale.