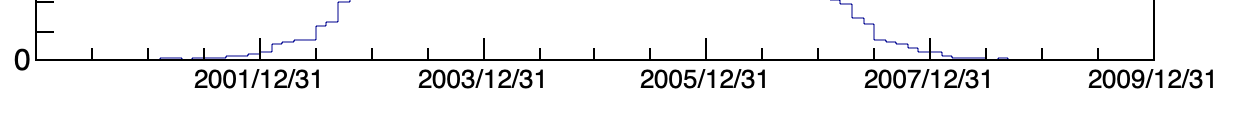
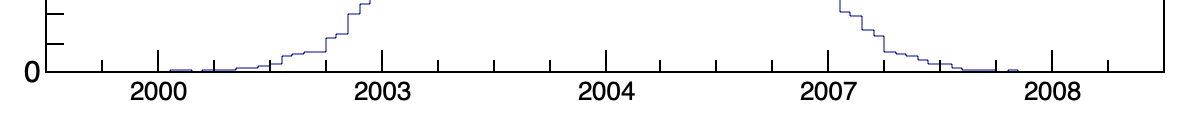
I wonder if there are some thoughts on plotting time axis where the display is incorrect or at least confusing. Take for example the tutorial script timeonaxis2.C which I have slightly modified:
Not really. Yes, the time being are equidistant in seconds and for sure you may end up which such labeling. But what would you like to see? some automatic “cheating” to adjust all the labels to January 1st? There is no such mechanism.
Olivier, the first plot I show is wrong and misleading. And both are not acceptable in any publication. Other packages can plot time axes correctly.
As far as I see there are two options:
Do not plot equidistant bins. This in the current setup is probably not so easy because now a separate axis routine has to be developed just for the time axis.
Manipulate the labels (you call it cheat) so that for instance with “%Y/%m/%d” adding/subtracting a fraction of a day results in the same month as the first label in the plot. The “misplacement” will be less than the thickness of the tick marks.
Eddy, the time axis is based on seconds, and of course, going to days months and year may end up with such an effect. There is no automatic mechanism to bypass that in ROOT. I can imagine possible workarounds:
Olivier, the fact that the time axis is based on seconds is not relevant for my option 2, just replace fraction of day by the equivalent amount in seconds.
The bottom line is that it has been expressed by the ROOT team that they want to be competitive with for instance R, the current time axis implementation is not helping.
Can it be that the problem is that the time value is “truncated” while it should be “rounded to the nearest”?
Something like this … assume several seconds/minutes/hours are “missing” to the end of 2003, so it now displays “2003” (or “2003/12/31”), while it should display “2004” (or “2004/01/01”).
The equidistant labeling over time spans that contain leap years causes the effects I showed. Of course displaying time spans of several months, the 30/31 changes will cause similar effects.
Codes like R, matplotlib etc seems to avoid this odd labeling in some way either through option 1 or 2 as I pointed out above.
Oliver pointed out yet another issue in the time axis code in ROOT. He executed my code in the Geneva time zone and said it has no display issues. Put your computer in the New York time zone and you will see my picture …
“Rounding” would work for "%Y" (“nearest” beginning of a year), "%Y/%m" (“nearest” beginning of a month), and "%Y/%m/%d" (“nearest” beginning of a day, so, for leap years, starting from noon 02/29 you would get 03/01).
Well, for “equidistant binning” and a sufficiently long time span, instead of "%Y/%m/%d", one might like to use "%Y/%m/01" (this should “eliminate” problems with months having 28/29/30/31 days).
BTW. Note that TDatime has no support for time zones. It always unconditionally assumes “local time” of the machine where ROOT runs, so, e.g., expect problems when “offsetting” zones with different “daylight savings”. Actually, I don’t know how it stores data when the local “daylight saving time” begins / ends (does one get an hour “missing” / “repeated” ?).