I am new to this field and I am having a tough time to understand this histogram. I want to understand what Entries, Event number, N_hits, mean in the attached histogram. Also what does the vertical axis represent (I understand that typically the vertical axis correspond to frequency but here I am not able to connect it to particle collision/interaction ?
I will be grateful anyone can breakdown the entire scenario.

Welcome to the ROOT forum
It looks like you are producing these two plots from a TTree. Did you create the tree yourself or did you get it from some experimental results ? In the second case you may ask the author(s) of that tree for some help. They will know the meaning of the tree’s variables.
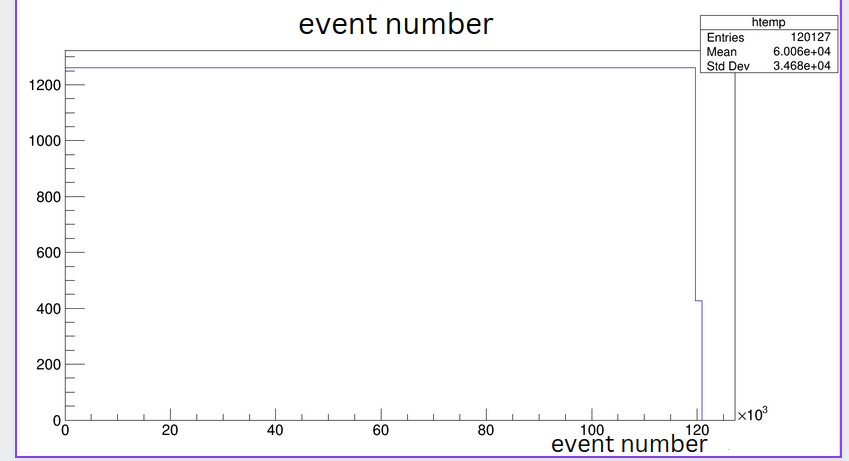
Nevertheless, given the name of your histograms we can guess that the first one represent the number of hits in some “detector”. It looks like almost all the hits are in the first cell (bin). There is a few on the right part. You will see them better if you turn the log scale “on” for the Y axis. In the second histogram it looks like you are making a distribution with the “event number”. Usually this does not give meaningful information as, very likely, it is just the line number in the tree.
Hi,
Thanks a lot for explaining.
No, I didn’t create the tree myself, I found it inside a root file given to me. I am trying to figure out the hits in 300 scintillator planes in a detector.
Best,
Rana
Hi @Rana
May be you can get some help from the people who created this ROOT tree ? They can tell you what the various variables are.