I am trying to do an unbinned 2D fit where I create the PDFs from 2D histograms, where one of the axis of the histogram has variable bins and the other axis has uniform bins. My model looks something like:
RooHistPdf rBkg1_Pdf("rBkg1_Pdf","rBkg1_Pdf",RooArgSet(rMass,rPt),RooDataHist("rBkg_hist","rBkg_hist",RooArgList(rMass,rPt),hBkg),0);
RooHistPdf rComp_Pdf("rComp_Pdf","rComp_Pdf",RooArgSet(rMass,rPt),RooDataHist("rComp_Hist","rComp_Hist",RooArgList(rMass,rPt),hComp),order);
RooRealVar f2("f2","Number of particles",0,nEntries);

RooAddPdf Model("Model","Extended sum templates",RooArgList(rBkg1_Pdf,rComp_Pdf),
						 RooArgList( RooConst(f1),f2,));
where f1 is fixed and only f2 is a free parameter in the fit.
But I encountered the following problems:
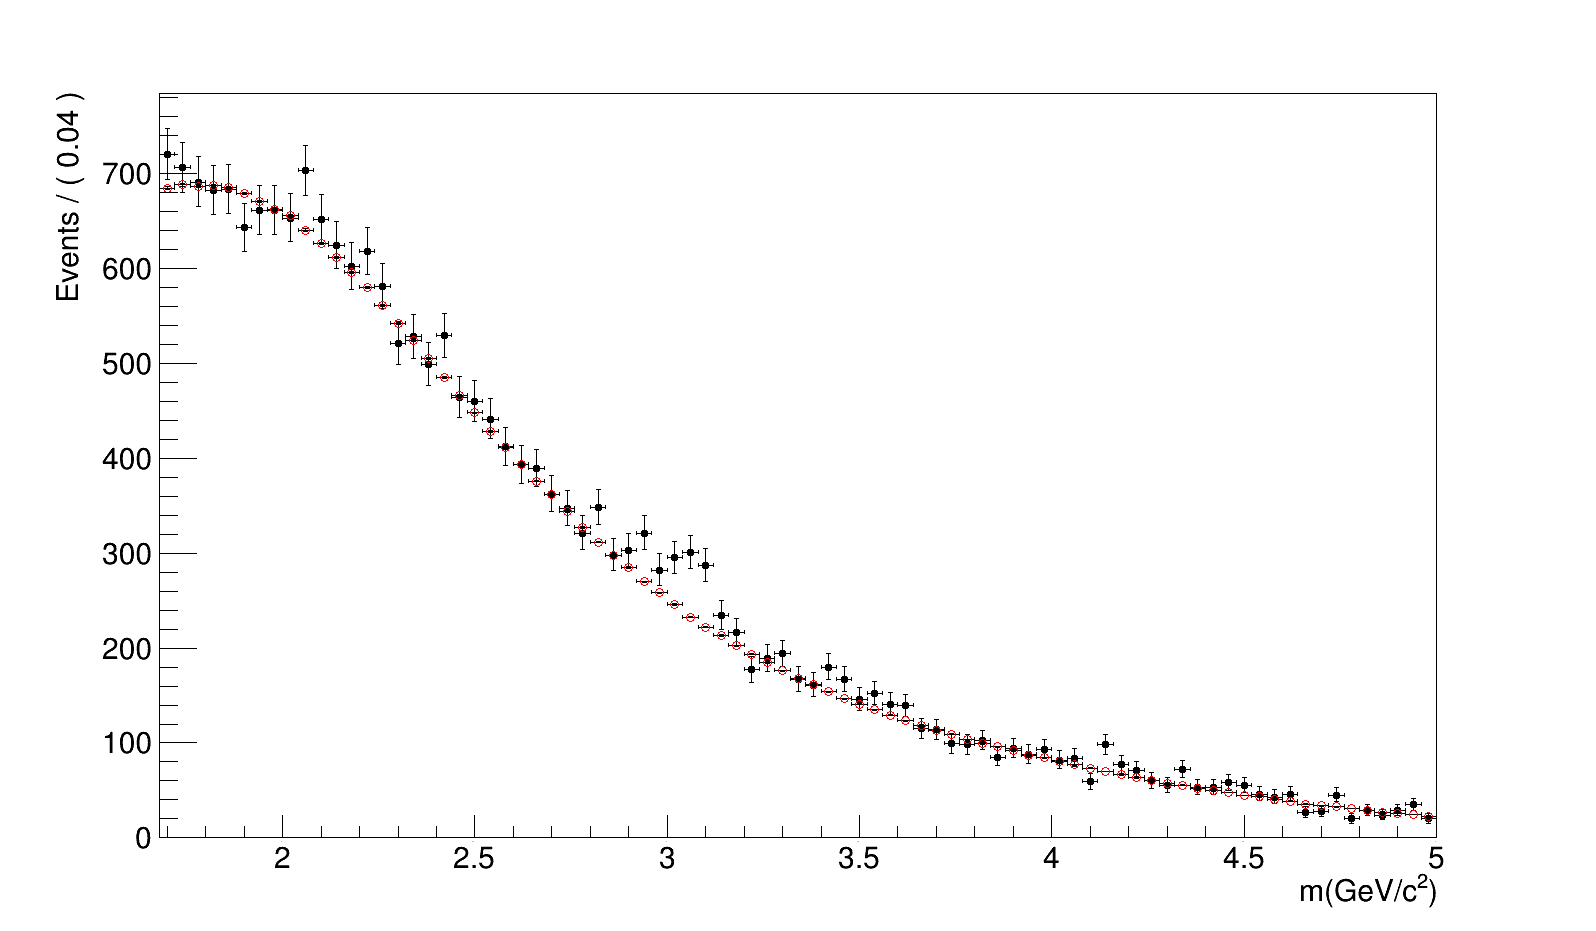
After I fit the data and make the projection in a given rPt range with uniform rMass bins and I plot only the rBkg1_Pdf component I see there is a shift, even tho f1 is fixed. You can see this in the plots below where I compared the data with the histogram (that is use for the PDF) and what I get when i plot the component from the fit.
How can I make this component from the fit to have the same shape as the red open bullet histogram?
If I look at the other projection where I have variable bins , the fit is working, but I see the normalization is off because I have variable bins. Do you have any suggestions how can I fix this?
Hi,
I could run your code, but let me understand better the problem.
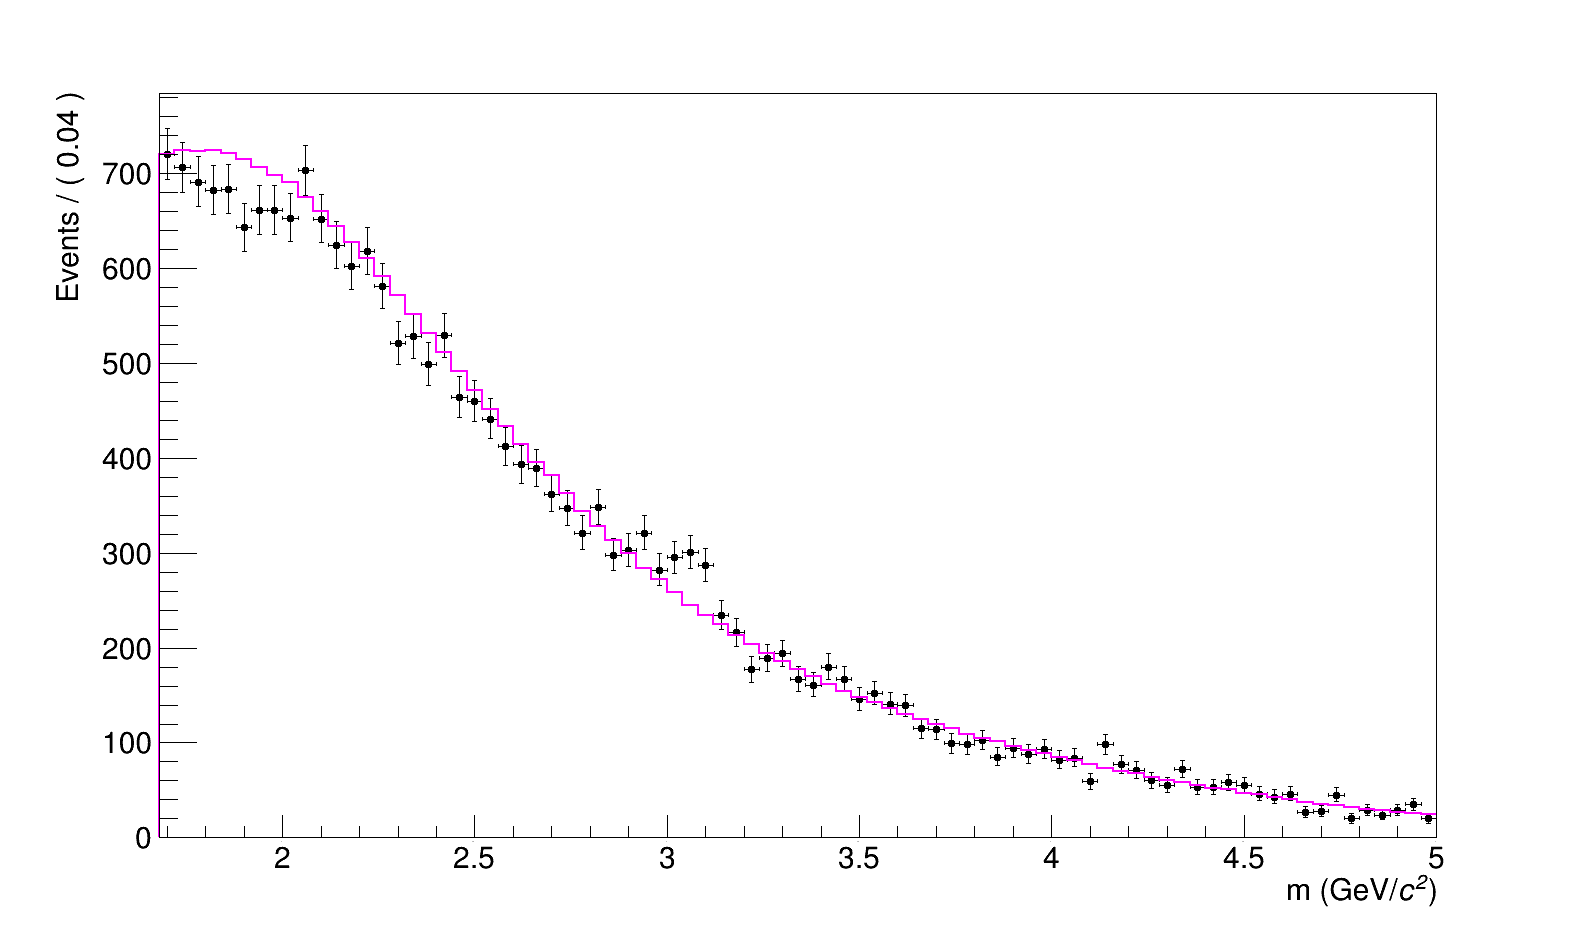
The issue is that when plotting the background component from the fit (magenta line) is not in agreement with the underlined used histogram (red dots) ?
Hi,
The normalisation of the background component (magenta line) is different than the one of the background histogram (red dot) because it contains a different background fraction.
Although the number of background events is fixed in the fit, the ratio that is equal to the number of background events to the total expected events is not fixed. So this explains this normalisation difference .
The solution is to scale down the Component pdf according to the fitted fraction. In this way you eliminate the background fraction from the plot. To do that do:
Thank you for the answer. This indeed solved the problem.
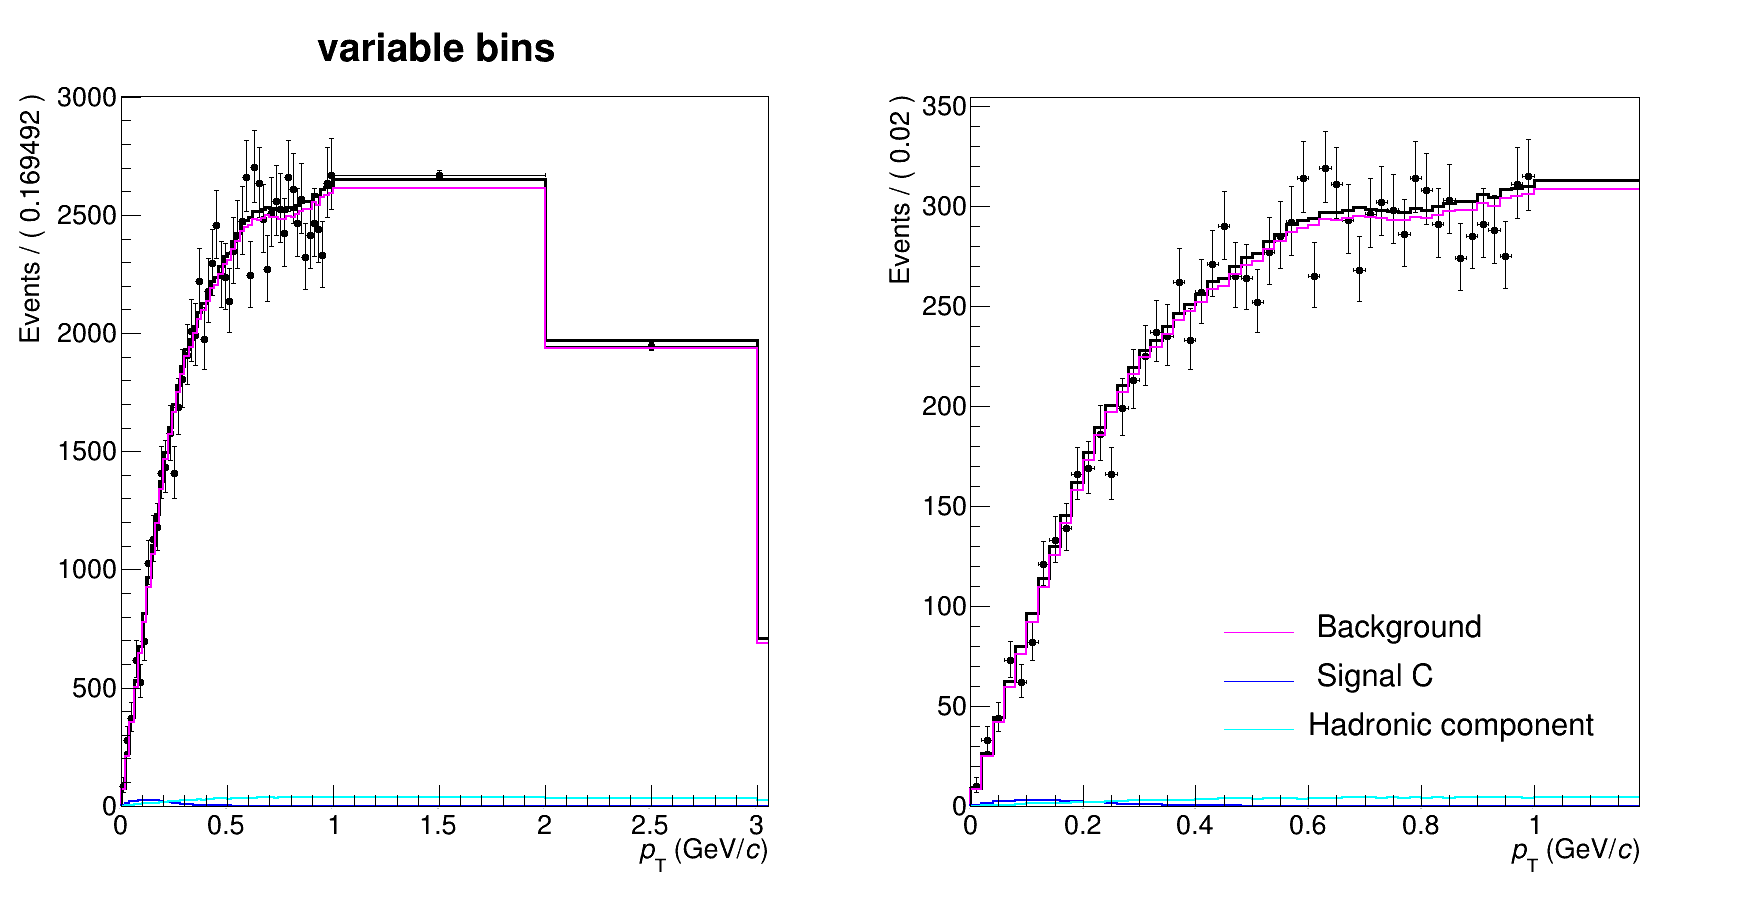
The other issue that I have is with making the projection when the bins are not uniform. The normalization doesn’t seem to be right. For the case when I have uniform bins (right plot) I get the right values, but then if I add extra new bins with different widths (left plot), the results are different in the same pT region.
What is the problem with the left plot ? Note the overall scale is different, in the case of variable bins, RooFit normalise the data to display number of events/(average bin width) and in this case is 0.169482, as shown in the y axis label.
In case of fixed bins, the normalisation is number of events/bin width and this corresponds normally to the actual number of observations / bin.
Thanks for letting me know. Is there any way to make Roofit to normalize the data to the bin width and not to the average bin width when I have variable bins?