#include <TMath.h>
#include <TGraph2D.h>
#include <TRandom.h>
#include <TStyle.h>
#include <TCanvas.h>
#include <TF2.h>
#include <TH1.h>
using namespace std;
void TGraph2D_test()
{
TGraph2D *graph = new TGraph2D("dihcorr1.txt");
TCanvas *c=new TCanvas;
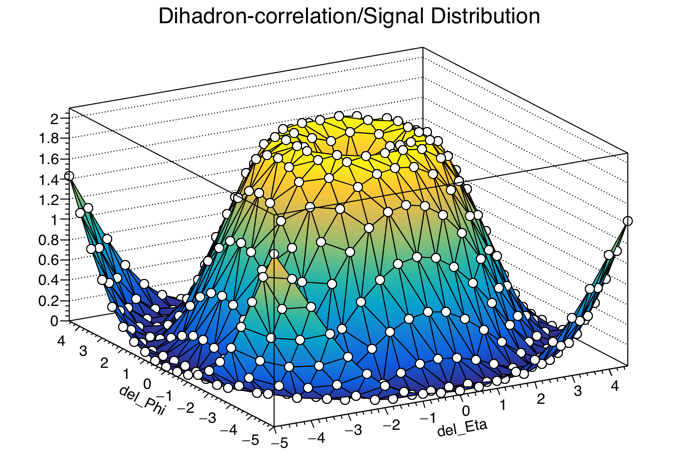
graph->SetTitle("Dihadron-correlation/Signal Distribution");
graph->Draw("surf1");
graph->GetYaxis()->SetTitle("del_Phi");
graph->GetXaxis()->SetTitle("del_Eta");
}
   dt->GetHistogram()->GetYaxis()->SetTitle("del_Phi");
   dt->GetHistogram()->GetXaxis()->SetTitle("del_Eta");
Hello,
thanks for your reply. but what does this mean. please explain.
Try: graph->SetTitle("Dihadron-correlation/Signal Distribution;del_Eta;del_Phi");
I tried. it worked already, it is to set the title of the Graph itself. I want to set the title of x and y indivisually.
Note the syntax: graph->SetTitle(“Global Graph Title;X axis Title;Y axis Title;Z axis Title”);
Hello Wile
Yeah really it worked. But Title text is overlapping the bins. Can you suggest how to manage to take title in the center of the axis.
Try: graph->Draw("surf1");
gPad->Modified(); gPad->Update(); // make sure it's really (re)drawn
graph->GetXaxis()->CenterTitle(kTRUE);
graph->GetXaxis()->SetTitleOffset(1.5);
graph->GetYaxis()->CenterTitle(kTRUE);
graph->GetYaxis()->SetTitleOffset(1.5);
gPad->Modified(); gPad->Update(); // make sure it's really (re)drawn
Wile
It didnt work…
void TGraph2D_test()
{
   Double_t P = 5.;
   Int_t npx  = 20 ;
   Int_t npy  = 20 ;
   Double_t x = -P;
   Double_t y = -P;
   Double_t z;
   Int_t k = 0;
   Double_t dx = (2*P)/npx;
   Double_t dy = (2*P)/npy;

   auto *graph = new TGraph2D();

   graph->SetNpy(41);
   graph->SetNpx(40);
   for (Int_t i=0; i<npx; i++) {
      for (Int_t j=0; j<npy; j++) {
         z = sin(sqrt(x*x+y*y))+1;
         graph->SetPoint(k,x,y,z);
         k++;
         y = y+dy;
      }
       x = x+dx;
       y = -P;
   }


   graph->SetTitle("Dihadron-correlation/Signal Distribution");

   // Axis titles are hold by the underlying histogram. To change the axis titles
   //  one needs to change the axis title of the underlying histogram.
   // TGraph2D Does not have the shortcut method to set the axis titles directly.
   //
   // note that the syntax:
   //     graph->SetTitle("Global Graph Title;X axis Title;Y axis Title;Z axis Title");
   // is also valid
   graph->GetHistogram()->GetYaxis()->SetTitle("del_Phi");
   graph->GetHistogram()->GetXaxis()->SetTitle("del_Eta");

   // Titles offset
   graph->GetHistogram()->GetXaxis()->SetTitleOffset(1.5);
   graph->GetHistogram()->GetYaxis()->SetTitleOffset(1.5);

   // Titles are centered
   graph->GetHistogram()->GetXaxis()->CenterTitle(true);
   graph->GetHistogram()->GetYaxis()->CenterTitle(true);

   graph->Draw("Tri1 p0");
}
1 Like
Hi
Using this setting the titles same as here, but the graph has no color. What can I do for this?
Post a running macro reproducing the problem.
void TGraph2D_test()
{
	TGraph2D *graph = new TGraph2D("dihcorr1.txt");
	TCanvas *c=new TCanvas;
	//graph->SetTitle("Dihadron-correlation/Signal Distribution;del_Eta;del_Phi;Signal Distribution(delEta,delPhi)");
	graph->GetXaxis()->CenterTitle(kTRUE);
	graph->GetYaxis()->CenterTitle(kTRUE);
	graph->SetMarkerStyle(20);
	graph->SetTitle("Dihadron-correlation/Signal Distribution");
	graph->GetHistogram()->GetYaxis()->SetTitle("del_Phi");
	graph->GetHistogram()->GetZaxis()->SetTitle("S(delta_Eta,delta_Phi)");
        graph->GetHistogram()->GetXaxis()->SetTitle("del_Eta");
	graph->GetHistogram()->GetXaxis()->SetTitleOffset(1.5);
   	graph->GetHistogram()->GetYaxis()->SetTitleOffset(1.5);
	graph->GetHistogram()->GetZaxis()->SetTitleOffset(1.5);
	graph->GetHistogram()->GetXaxis()->CenterTitle(true);
	graph->GetHistogram()->GetZaxis()->CenterTitle(true);
  	graph->GetHistogram()->GetYaxis()->CenterTitle(true);
	graph->Draw("surf1");
}
We are missing the file dihcorr1.txt
This topic was automatically closed 14 days after the last reply. New replies are no longer allowed.