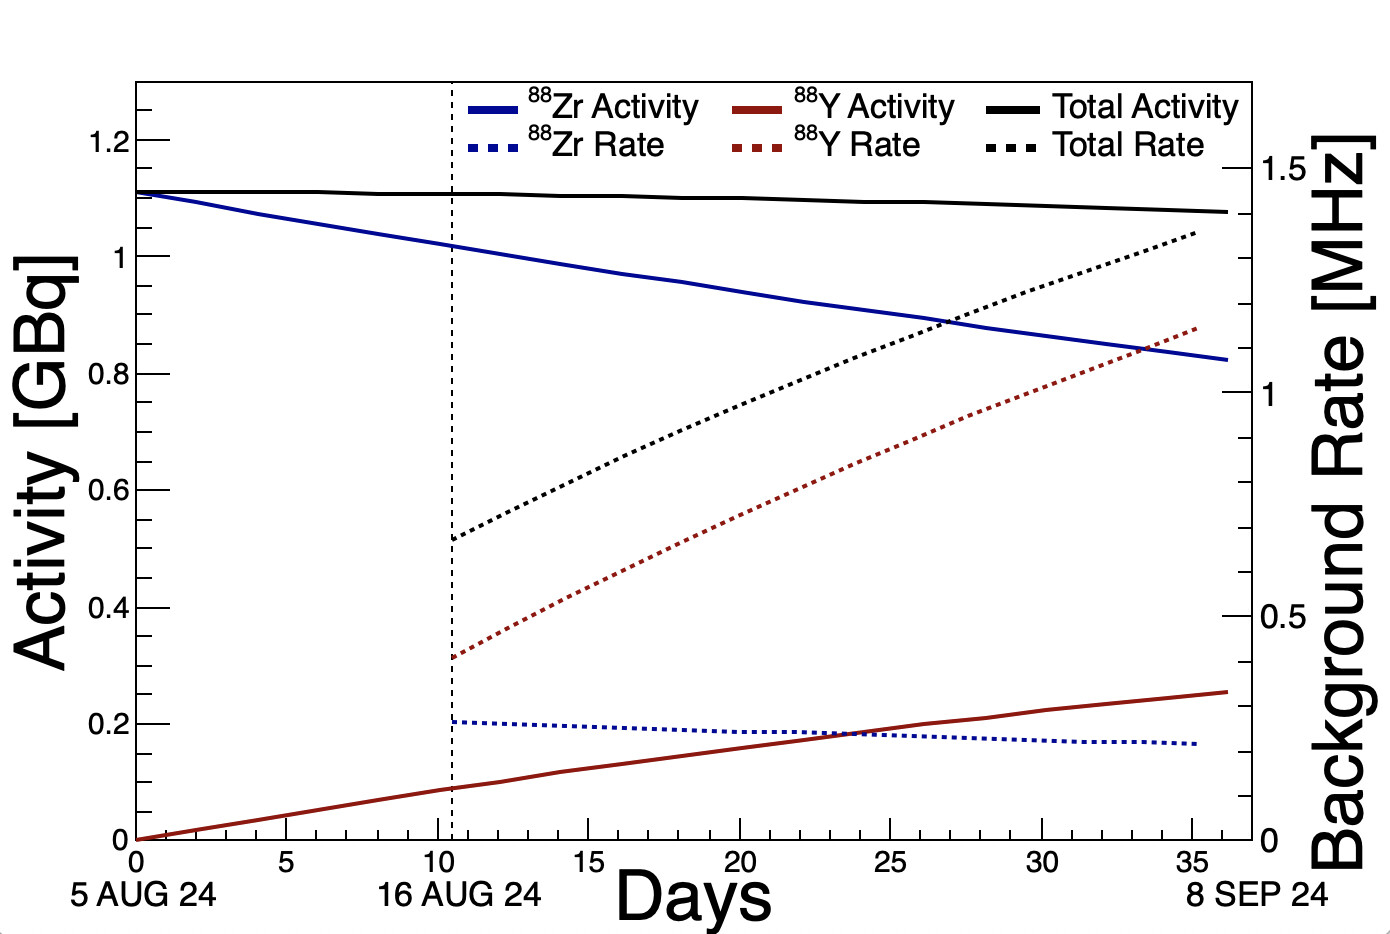
I have two questions relating to a plotting macro, code below and output pdf attached.
(1) When I draw TGraphs on a dummy TH2D (for formatting), why doesn’t my TGraph continue to the x-maximum of the plot range? As a corollary, I am puzzled why i have to subtract 1 in the TGraph range to make it properly align.
(2) How can I nudge up my second y-axis on the right side? For instance, is it possible to add blank spaces or tabs to the content of TAxis titles?
Many thanks in advance for the help.
-Will
ActivityAndRates.pdf (14.4 KB)
Rates.C (3.8 KB)
void Rates(){
TCanvas *c1 = new TCanvas(“c1”,“”,700,500);
gStyle->SetOptStat(0);
gStyle->SetLegendBorderSize(0);
TH2D *hDummy = new TH2D(“hDummy”,“”,1000,0,37,1000,0,1.30);
hDummy->Draw();
hDummy->GetXaxis()->SetTitle(“Days”);
hDummy->GetXaxis()->CenterTitle();
hDummy->GetXaxis()->SetTitleSize(0.08);
hDummy->GetXaxis()->SetTitleOffset(0.5);
hDummy->GetYaxis()->SetTitle(“Activity [GBq]”);
hDummy->GetYaxis()->CenterTitle();
hDummy->GetYaxis()->SetTitleSize(0.08);
hDummy->GetYaxis()->SetTitleOffset(0.5);
TGaxis *axis = new TGaxis(37,0.0, 37, 1.15,0,1.5,51,“+L”);
axis->SetNdivisions(505);
axis->SetLabelFont(gStyle->GetLabelFont(“Y”));
axis->SetTitleFont(gStyle->GetTitleFont(“Y”));
axis->SetTitle(“Background Rate [MHz]”);
axis->CenterTitle();
axis->SetTitleSize(0.08);
axis->SetTitleOffset(0.5);
axis->Draw();
TLine *line = new TLine(10.5,0,10.5,1.30);
line->SetLineStyle(2);
line->Draw(“same”);
double Act_Zr88_0 = 1.11; // GBq
double tHalf_Zr88 = 83.4; // days
double tHalf_Y88 = 106.629; // days
double Eff_Zr88 = 0.0002;
double Eff_Y88 = 0.0035;
TF1 *fAct_Zr88 = new TF1(“fAct_Zr88”,“[0]*exp(-log(2.0)*x/[1])”,-1,200);
fAct_Zr88->SetParameters(Act_Zr88_0, tHalf_Zr88);
fAct_Zr88->SetLineColor(kBlue+2);
fAct_Zr88->SetLineWidth(4);
fAct_Zr88->Draw(“same”);
TF1 fAct_Y88 = new TF1(“fAct_Y88”,"(1.0/[1])/(1.0/[2]-1.0/[1])[0]*(exp(-log(2.0)*x/[1])-exp(-log(2.0)*x/[2]))",-1,200);
fAct_Y88->SetParameters(Act_Zr88_0, tHalf_Zr88, tHalf_Y88);
fAct_Y88->SetLineColor(kRed+2);
fAct_Y88->SetLineWidth(4);
fAct_Y88->Draw(“same”);
TF1 *fAct_Tot = new TF1(“fAct_Tot”,“[0]exp(-log(2.0)x/[1])+(1.0/[1])/(1.0/[2]-1.0/[1])[0](exp(-log(2.0)*x/[1])-exp(-log(2.0)*x/[2]))”,-1,200);
fAct_Tot->SetParameters(Act_Zr88_0, tHalf_Zr88, tHalf_Y88);
fAct_Tot->SetLineColor(kBlack);
fAct_Tot->SetLineWidth(4);
fAct_Tot->Draw(“same”);
TF1 fBkg_Zr88 = new TF1(“fBkg_Zr88”,"1000[3]*[0]*exp(-log(2.0)*x/[1])",9.5,200);
fBkg_Zr88->SetParameters(Act_Zr88_0, tHalf_Zr88, tHalf_Y88, Eff_Zr88);
fBkg_Zr88->SetLineColor(kBlue+2);
fBkg_Zr88->SetLineWidth(4);
fBkg_Zr88->SetLineStyle(7);
fBkg_Zr88->Draw(“same”);
TF1 fBkg_Y88 = new TF1(“fBkg_Y88”,"1000[4](1.0/[1])/(1.0/[2]-1.0/[1])[0]*(exp(-log(2.0)*x/[1])-exp(-log(2.0)*x/[2]))",9.5,200);
fBkg_Y88->SetParameters(Act_Zr88_0, tHalf_Zr88, tHalf_Y88, Eff_Zr88, Eff_Y88);
fBkg_Y88->SetLineColor(kRed+2);
fBkg_Y88->SetLineWidth(4);
fBkg_Y88->SetLineStyle(7);
fBkg_Y88->Draw(“same”);
TF1 fBkg_Tot = new TF1(“fBkg_Tot”,"1000[3][0]exp(-log(2.0)x/[1])+1000[4](1.0/[1])/(1.0/[2]-1.0/[1])[0]*(exp(-log(2.0)*x/[1])-exp(-log(2.0)*x/[2]))",9.5,200);
fBkg_Tot->SetParameters(Act_Zr88_0, tHalf_Zr88, tHalf_Y88, Eff_Zr88, Eff_Y88);
fBkg_Tot->SetLineColor(kBlack);
fBkg_Tot->SetLineWidth(4);
fBkg_Tot->SetLineStyle(7);
fBkg_Tot->Draw(“same”);
TLegend* legZr88 = new TLegend(0.33, 0.81, .50, .89);
legZr88->SetTextSize(0.04);
legZr88->AddEntry(fAct_Zr88, “^{88}Zr Activity”, “l”);
legZr88->AddEntry(fBkg_Zr88, “^{88}Zr Rate”, “l”);
legZr88->SetMargin(0.3);
legZr88->Draw(“same”);
TLegend* legY88 = new TLegend(0.52, 0.81, .69, .89);
legY88->SetTextSize(0.04);
legY88->AddEntry(fAct_Y88, “^{88}Y Activity”, “l”);
legY88->AddEntry(fBkg_Y88, “^{88}Y Rate”, “l”);
legY88->SetMargin(0.3);
legY88->Draw(“same”);
TLegend* legTot = new TLegend(0.70, 0.81, .89, .89);
legTot->SetTextSize(0.04);
legTot->AddEntry(fAct_Tot, “Total Activity”, “l”);
legTot->AddEntry(fBkg_Tot, “Total Rate”, “l”);
legTot->SetMargin(0.3);
legTot->Draw(“same”);
TLegend* legStart = new TLegend(0.05, 0.02, .15, .06);
legStart->SetTextSize(0.04);
legStart->SetHeader(“5 AUG 24”);
legStart->Draw(“same”);
TLegend* legBeam = new TLegend(0.27, 0.02, .37, .06);
legBeam->SetTextSize(0.04);
legBeam->SetHeader(“16 AUG 24”);
legBeam->Draw(“same”);
TLegend* legEnd = new TLegend(0.85, 0.02, .95, .06);
legEnd->SetTextSize(0.04);
legEnd->SetHeader(“8 SEP 24”);
legEnd->Draw(“same”);
c1->SaveAs(“ActivityAndRates.pdf”);
}