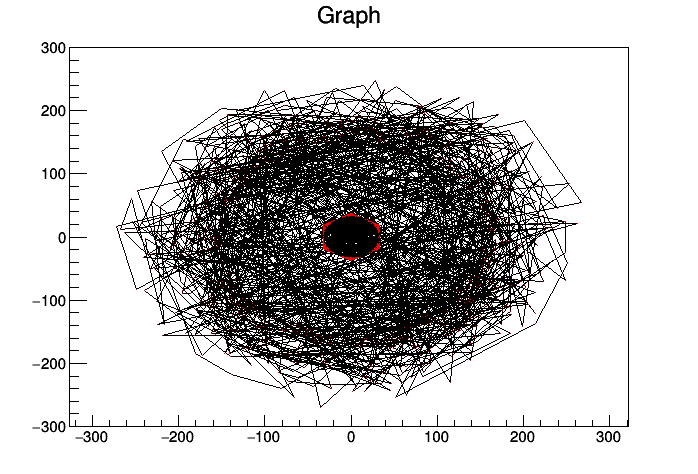
My code below iterates over an ntuple, I wish to print all the hits in an event such that all points that satisfy some rule are printed in blue, and all the others are printed in red. The results are shon below.
The printed graph can be seen under the code.
-
Why the blue dots do not appear?
-
Why are the dots conected by lines and how to cancel that?
  e = ntuple.__iter__().next()

  x_in, y_in = [], []
  x_out, y_out = [], []

  for rechit in e.recHits():
    if plane.is_contain(rechit.x(), rechit.y()):
      x_in.append(rechit.x())
      y_in.append(rechit.y())
    else:
      x_out.append(rechit.x())
      y_out.append(rechit.y())

  c = TCanvas()

  gh_in = TGraph(len(x_in), array("d", x_in), array("d", y_in));
  gh_in.SetFillColor(ROOT.kBlue)
  gh_in.SetMarkerStyle(1)
  gh_in.SetMarkerColor(ROOT.kBlue)
  gh_in.GetYaxis().SetRangeUser(-300, 300)
  gh_in.GetYaxis().SetRangeUser(-300, 300)

  gh_in.Draw()


  gh_out = TGraph(len(x_out), array("d", x_out), array("d", y_out));
  gh_out.SetFillColor(ROOT.kRed)
  gh_out.SetMarkerStyle(1)
  gh_out.SetMarkerColor(ROOT.kRed)
  gh_out.GetYaxis().SetRangeUser(-300, 300)
  gh_out.GetYaxis().SetRangeUser(-300, 300)
  gh_out.Draw()

  name = file_name(ntuple)
  c.SaveAs("geo_" + name + ".png")