I am performing a 2D fit in RooFit and would like to use a two-dimensional pullhist to assess the quality of the fit.
For a 1D fit this is rather simple. But for a 2D hist I get some problems with the scaling.
Using createHistogram I was able to create a TH2 of both, the fit function and the fitted data. In a first step I wanted to subtract them from each other. But here I already encounter a problem with the scaling of the fit function … it doesn’t match data. Btw. this is also the case for 1D plots, plotting the fit function w/o data shows a completely different scale.
So, long story short: How can I get the correct scaling when plotting the fit function only? Or did someone this 2D pullhist already?
So here is a quick follow-up. I suppose this problem is related to the overall normalization of the fit function when plotting. I reduced the problem to a 1D fit. The minimal code example is as follows
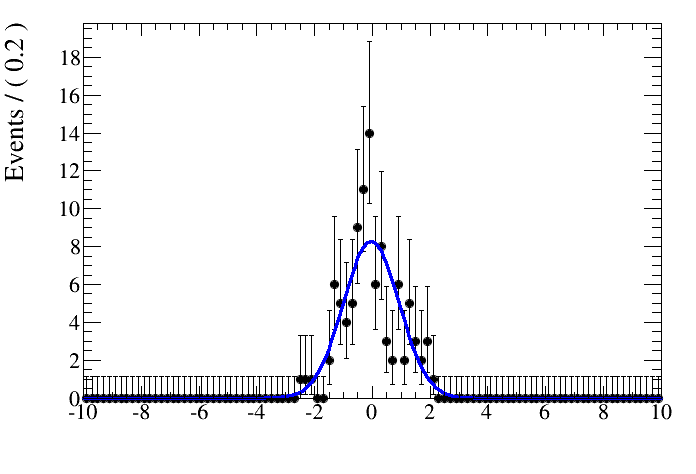
What I would have expected is that the drawn pdf would show that the signal yield is wrong. I get the same result when I constrain the signal yield N to values larger 1000, the fit is successful and the plot looks fine.
Is that an intended behavior? Am I doing something wrong here?