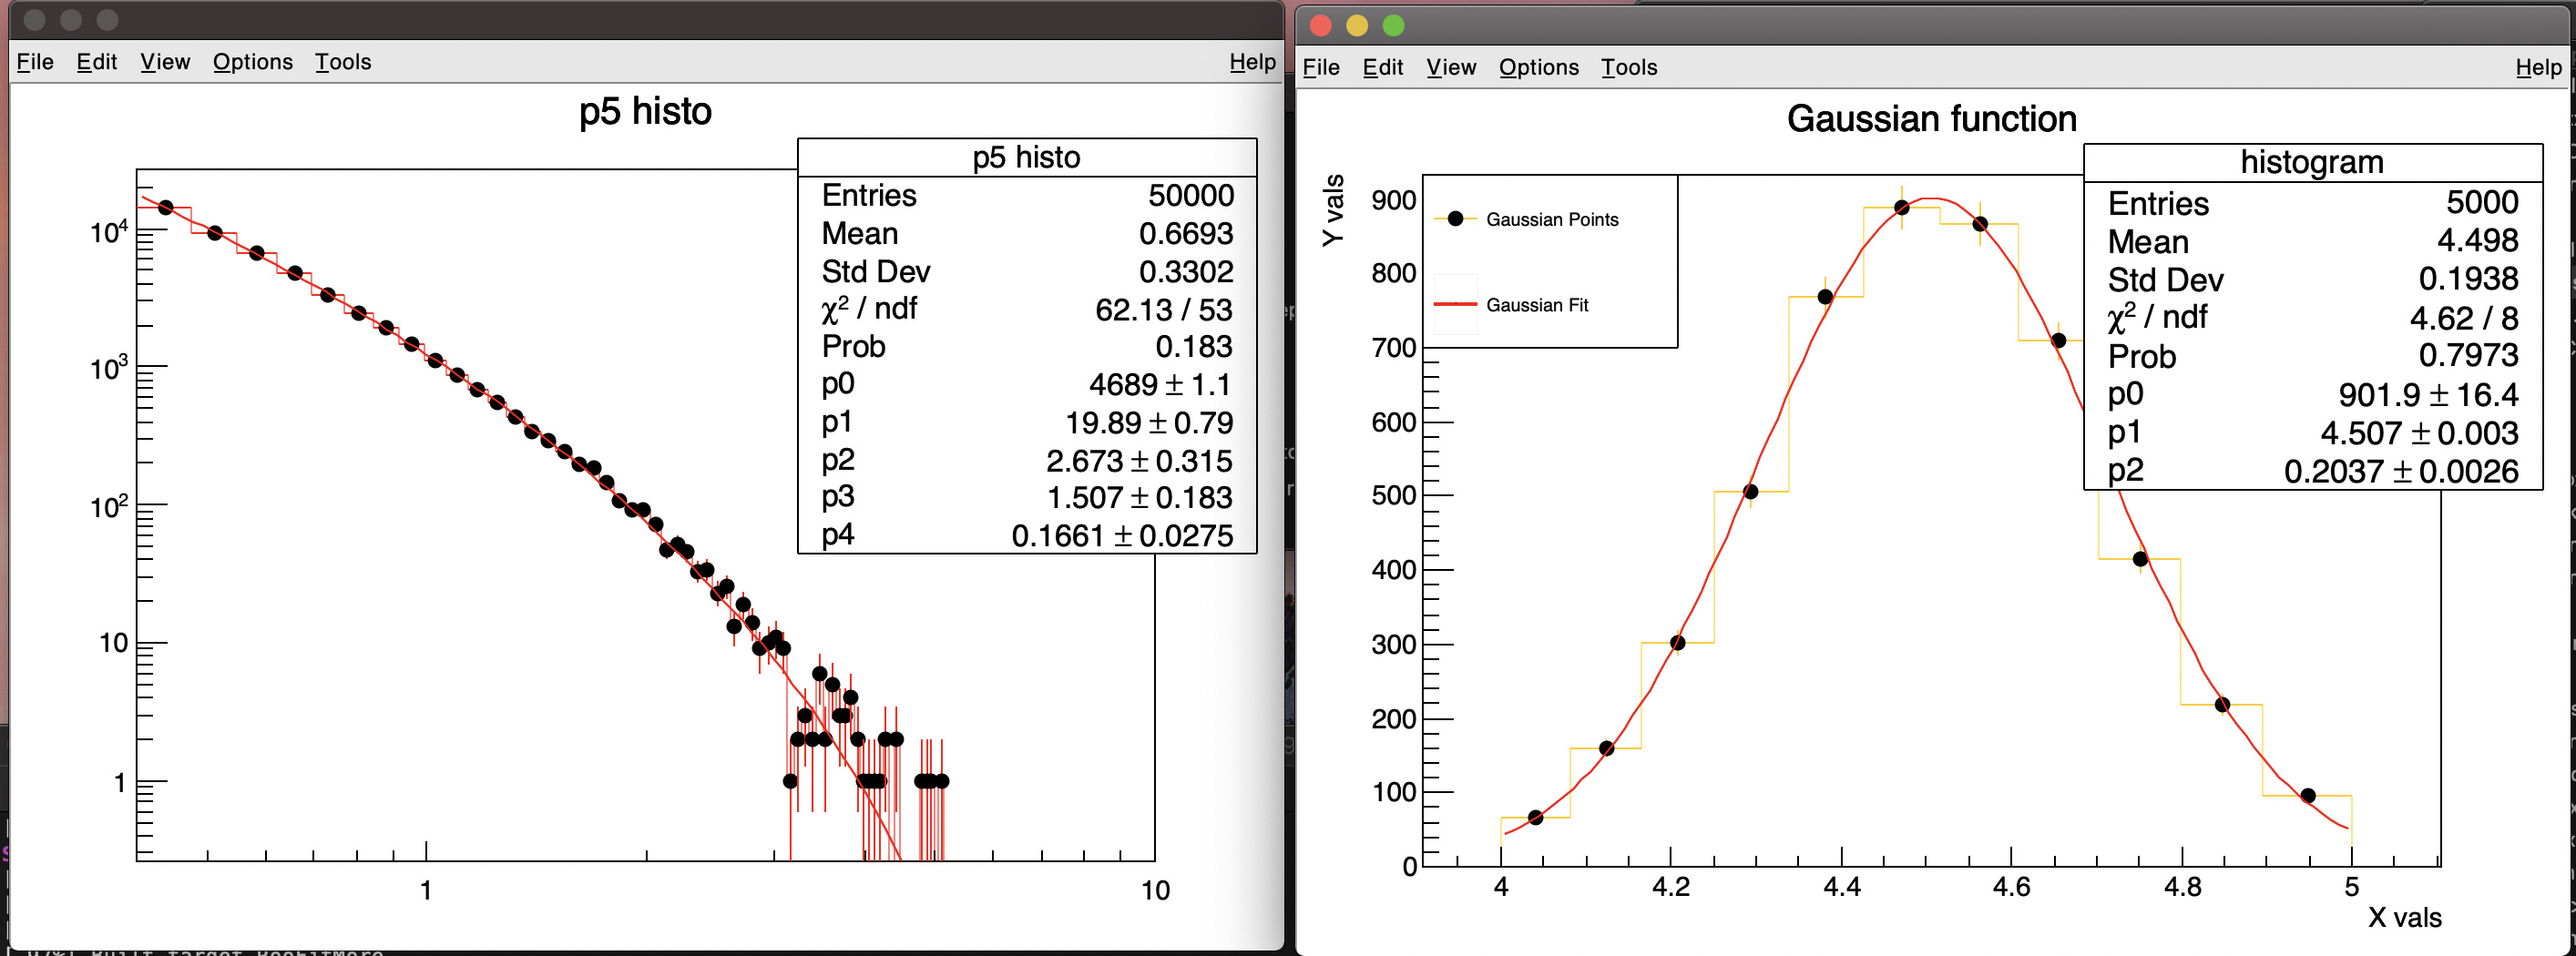
You are overwriting your plots. I modified a bit your macro:
void mc_gaus(){
TF1 parabola_5("para_five","([0]*((1-(x/13.0))**[1])*((x/13.0)**([2]+([3]*TMath::Log((x/13.0)))+([4]*(TMath::Log((x/13.0))^2)))))",0.4,10);
parabola_5.SetParameter(0,20.12911e-01);
parabola_5.SetParameter(1,1.33731e+01);
parabola_5.SetParameter(2,-1.87060e-01);
parabola_5.SetParameter(3,8.84446e-01);
parabola_5.SetParameter(4,1.21341e-01);
auto pfivehisto = new TH1F("p5 histo","p5 histo",130,0.4,10.0);
pfivehisto->SetMarkerStyle(8);
pfivehisto->SetLineColor(kRed);
gStyle->SetOptFit(1111);
TCanvas *c1 = new TCanvas("c1");
c1->SetLogy();
c1->SetLogx();
for (int i=1; i<=50000;++i) pfivehisto->Fill(parabola_5.GetRandom(0.4,10.0));
parabola_5.SetParameter(0,1.77279e+06);
parabola_5.SetParameter(1,15.4542);
int npar = parabola_5.GetNpar();
cout << "npar=" << npar << endl;
for (int ipar=2; ipar<npar;++ipar) parabola_5.SetParameter(ipar,1);
pfivehisto->Fit(¶bola_5);
pfivehisto->Draw("PE SAME");
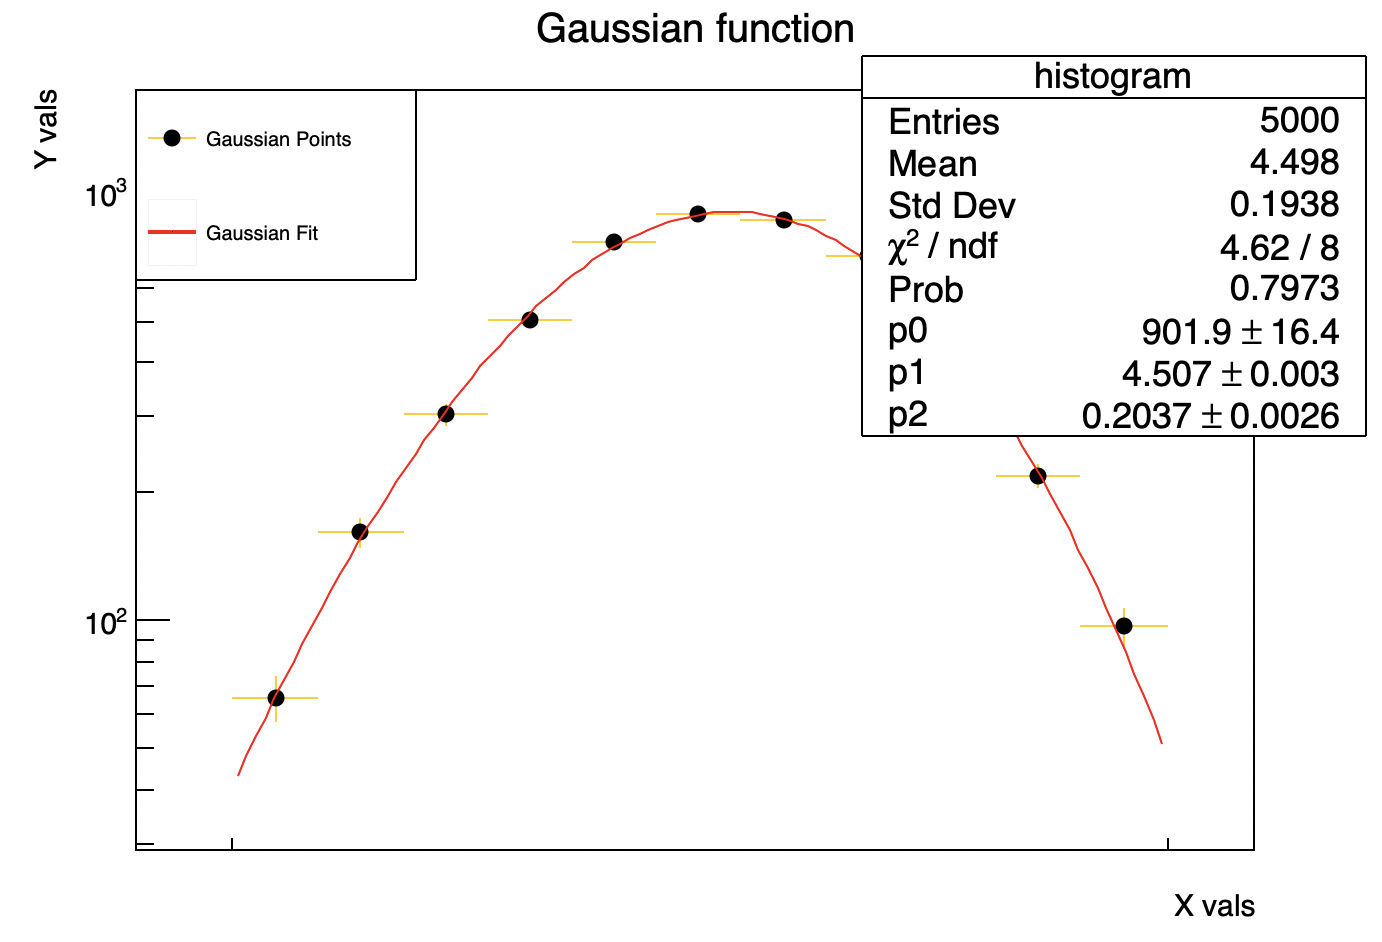
TF1* g = new TF1("gaus","[0]*TMath::Gaus(x,[1],[2])",4.0,5.0);
double a=0.1, b=4.5, c=0.2;
g->SetParameter(0,a);
g->SetParameter(1,b);
g->SetParameter(2,c);
g->SetLineColor(kRed);
double edges[12] = {4.0,4.082,4.166,4.251,4.338,4.426,4.516,4.609,4.703,4.799,4.896,5.0};
TCanvas *c2 = new TCanvas("c2");
auto histogram = new TH1F("histogram","Gaussian function;X vals;Y vals",11,edges);
histogram->SetMarkerStyle(8);
histogram->SetLineColor(kOrange);
for (int i=1; i<=5000;++i) histogram->Fill(g->GetRandom(4.0,5.0));
histogram->Fit(g);
histogram->SetAxisRange(0.4,10,"x");
histogram->Draw("PE SAME");
auto leg = new TLegend(.1,.7,.3,.9,"");
leg->SetFillColor(0);
leg->AddEntry(histogram,"Gaussian Points");
leg->AddEntry(g,"Gaussian Fit");
leg->Draw();
cout << "Extracted Events = " << g->Integral(4.0,5.0)/(1.0/11.0)<<endl;
cout << "Number of Bins = " << (histogram->GetXaxis()->FindFixBin(5.0))-(histogram->GetXaxis()->FindFixBin(4.0))<<endl;
}
and I get this: