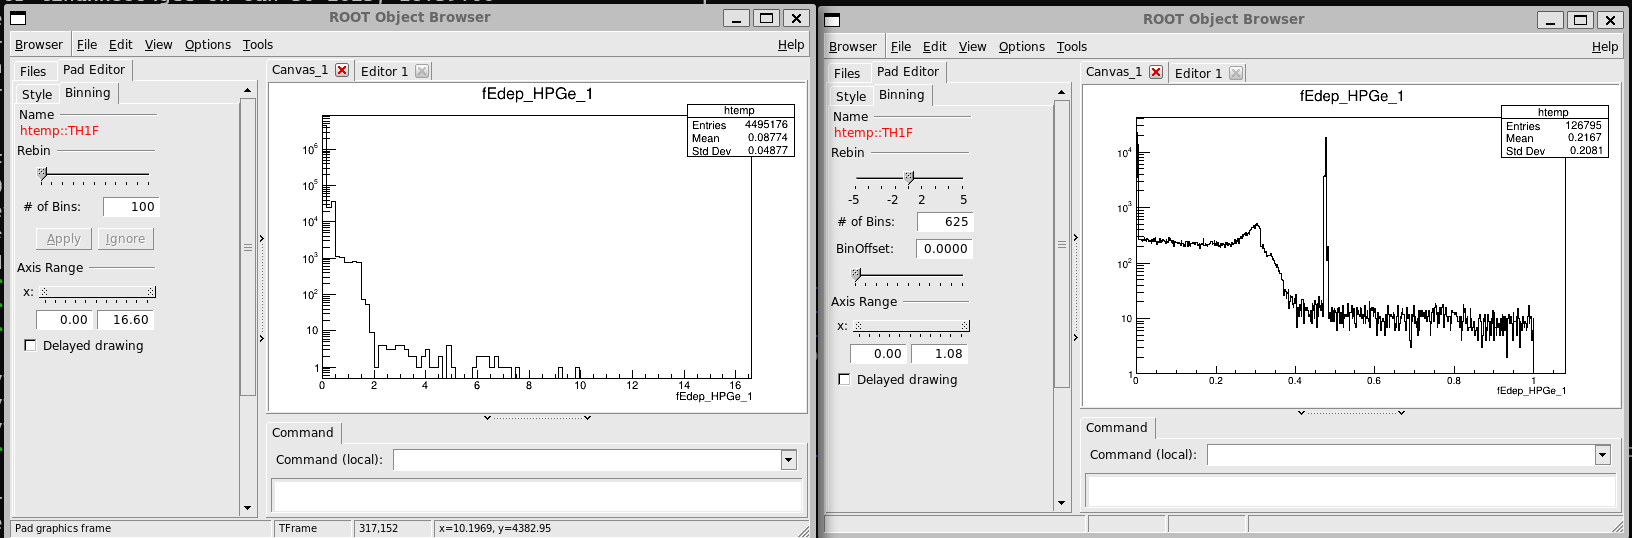
I am trying to visualize some data from a Geant4 simulation using the TBrowser, and whenever I try to adjust the binning of the histograms, I get one of two options, shown below:
I get to these options by selecting View->Editor on the window, and then clicking on the sides of the bars of the histogram.
I am not sure why I get two different binning options, but I prefer the one on the right, since I can generate more than 100 bins. The one on the left will not allow me to visualize more than 100 bins.
The only way I have been able to get the binning style on the right is when I exclude some data from collection in the simulation.
Is there some sort of option I could use so I can increase the binning to more than 100?
Thank you
ROOT Version: 6.26/10 Platform: Ubuntu 9.4.0 Compiler: Not Provided
I hope @couet can shed some light on why two binnings are different based on the options chosen, maybe there is some way in code to fix the option. I would meanwhile suggest to start by using TH1::Rebin to select the number of bins you want for the histogram.
Interesting. I got this data from the same Geant4 simulation, but I ran the one on the left with 10 times more events. I am not sure why it would draw the two graphs in two different ways, since they both use n-tuples.