Two axes on the same histogram

Dear rooters,

I am trying to plot two axes on the same histogram (main axis is for non calibrated values and the TGAxis is obtained after calibration).
I know about the TGAxis and this is working (almost) perfectly, especially by adding it to the list of histogram functions.

I however have an issue: the display of the histogram is within a application (embedded canvas) and is dynamic (users zoom, fit, …). Hence both the displayed of X and Y axes (of a TH1) change regularly but the TGAxis, defined/instantiated with the user/histogram coordinate, keep moving up and down. I try SetNDC but it did not seem to work.

How can I force the TGaxis to be displayed just below the main X-axis, at a constant distance (+font size…) to it, and at the same time follow the main X-axis zoom ?

Thank you in advance
Best regards.
Julien

We’re looking into your question. Will follow up here…

I would draw the TGaxis in a pad which does not change doing the zooming operation.

Dear all,

I did try to draw it directly in the canvas, be it quickly disappears, as soon as I zoom on the histogram.
This is why I added it to the histogram’s list of functions.
Maybe I should try something else than just canvas->cd() ; axis->Draw()? Explicit SetOwner()?
If I try to redraw it after some zooming (albeit some failure probably due to my code) the axis is there but with an increased vertical size (and font).
I probably could “copy” the code for drawing axis of histograms in my app. (or add the drawing to some event in the embedded canvas) but maybe there is something easier or more straight forward?

Regards
Julien

can you provide a small reproducer ?

I managed to write a piece of code that reproduce the problem.
The code could have be simpler but I wanted to have the minimum algorithm I intend to use, including the GUI.
This being said I tested with a “normal” canvas in CINT and same problem. I am using ROOT 5-34-23

   TH1F *h =new TH1F("h","h",100,0,100);
   h->Draw();
   TF1 *f = new TF1("f","pol1",0,100);
   f->SetParameters(0,.1);

   TGaxis *AxisCal = new TGaxis(h->GetXaxis()->GetXmin(), // 
			gPad->PadtoY(0.01),
			h->GetXaxis()->GetXmax(),
			gPad->PadtoY(0.01),
			f->Eval(h->GetXaxis()->GetXmin()),
			f->Eval(h->GetXaxis()->GetXmax()),
			510,"-");
   AxisCal->Draw();

I also plot a commented “bad” result obtained after zooming the histogram interactively


Regards
JG
test.C (3.57 KB)

I would suggest the attached code…

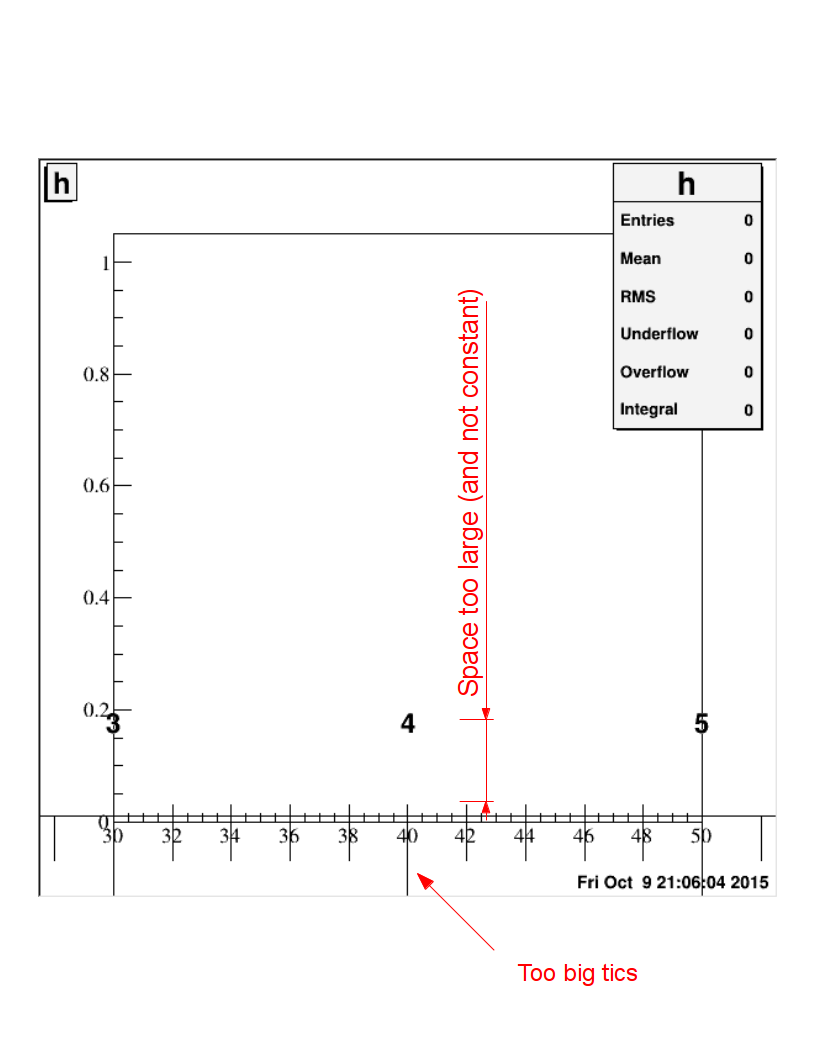
This code uses the Pad limits to define the axis length instead of the histogram min and max. Histogram min and max are always the same and when you zoom the length of the axis becomes very long compare to the window you see on screen. As the tick length and labels position are in % of the axis length they change accordingly … Then, when you zoom, the pad coordinates change, from the initial value, so the TGaxis needs to accommodate this changes in real time. That is why it I embedded it in a TExec,

TH1F *h;
TF1 *f;

void test()
{

   // main frame
   TGMainFrame *fMainFrame673 = new TGMainFrame(gClient->GetRoot(),10,10,kMainFrame | kVerticalFrame);
   fMainFrame673->SetName("fMainFrame673");
   fMainFrame673->SetLayoutBroken(kTRUE);

   // embedded canvas
   TRootEmbeddedCanvas *fRootEmbeddedCanvas560 = new TRootEmbeddedCanvas(0,fMainFrame673,360,288);
   fRootEmbeddedCanvas560->SetName("fRootEmbeddedCanvas560");
   Int_t wfRootEmbeddedCanvas560 = fRootEmbeddedCanvas560->GetCanvasWindowId();
   TCanvas *c123 = new TCanvas("c123", 10, 10, wfRootEmbeddedCanvas560);
   fRootEmbeddedCanvas560->AdoptCanvas(c123);
   fMainFrame673->AddFrame(fRootEmbeddedCanvas560, new TGLayoutHints(kLHintsLeft | kLHintsTop,2,2,2,2));
   fRootEmbeddedCanvas560->MoveResize(0,0,600,600);

   h =new TH1F("h","h",100,0,100);
   h->Draw();
   f = new TF1("f","pol1",0,100);
   f->SetParameters(0,.1);

   TExec *ex = new TExec("ex","DrawAxisCal();");
ex->Draw();
   fMainFrame673->SetMWMHints(kMWMDecorAll,
                        kMWMFuncAll,
                        kMWMInputModeless);
   fMainFrame673->MapSubwindows();

   fMainFrame673->Resize(fMainFrame673->GetDefaultSize());
   fMainFrame673->MapWindow();
   fMainFrame673->Resize(600,600);
}

void DrawAxisCal()
{
   TGaxis *AxisCal = new TGaxis(
         gPad->GetUxmin(),
         gPad->PadtoY(0.01),
         gPad->GetUxmax(),
         gPad->PadtoY(0.01),
         f->Eval(h->GetXaxis()->GetXmin()),
         f->Eval(h->GetXaxis()->GetXmax()),
         510,"S-");

   AxisCal->SetTickSize(0.02);
   AxisCal->Paint();
}

Olivier,

Thank you for the proposed solution. Did not know about TExec. Very useful.

The code is working but if one would like to have the 2nd axis changed according to the zoom, I suggest to
h->GetXaxis()->GetXmin() and h->GetXaxis()->GetXmax() be placed by
h->GetXaxis()->GetFirst() and h->GetXaxis()->GetFirst() respectively.

Regards
Julien

Yes you have to adapt want you want to see. I just gave you the idea.
TExec is a very powerful class allowing a lot of flexibility.
root.cern.ch/doc/master/classTExec.html

Olivier,

I allow myself to ask one more question: all the code I am writing derived in fact from a TGMainFrame class and is a “self running” TApplication (compiled out of CINT).
I hence made the function DrawAxisCal() a member of my class but I have trouble to access it from TExec.
For example in a TGPictureButton, using Connect() it is possible to specify the class.
Do you see any solution to this ?

Regards
Julien

Ps: I feel the subject is shifting and I’d better start a new topic. Please advise

Can you access it if it is not a class method ?

it is difficult because the histogram h and function f used of the example are in fact private members (could be made public though) of the class.

Have you try to give ClassName::DrawAxisCal to TExec ?

Olivier,

Yes. Literally. Not surprisingly it failed with the error :

Yes sure … of course. What about a static function outside the callas calling some getters to retrieve the private histograms and function.

I tried to put the histogram and the function as global variables (as you did in your corrected example).
And made also DrawAxisCal() global (not a member of the class any more).
The result failed, surprisingly:

Ok … that’s weird… I was thinking that may be an other way would be to create your own Axis class with its Paint Method. It would call the TGaxis axis method to paint the axis but as it will be an object in the Pad it will be repaint each time the Pad will be repaint. It should Inherits from TObject to get the Draw() method for free.
The paint method being very similar to DrawAxisCal().

Olivier,

I went back to your previous suggestion and made the histogram, function and DrawAxisCal() global.
I found a way to make this solution works by adding them to the linkdef

#pragma link C++ function DrawAxisCal(); #pragma link C++ global fct; #pragma link C++ global histo;

Thank you for your help.

Regards
Julien

Ok good :slight_smile: