Two 1D histograms on one plot, zooming problem

So I have constructed the following macro using some old posts from this forum:

void draw_two_exps(TString filename1, TString filename2, TString histoName1, TString histoName2, TString outFolder = "pics_comparison")
{
   TFile* f1 = new TFile(filename1);
   TFile* f2 = new TFile(filename2);

   TH1D* h1 = NULL; h1 = (TH1D*)f1->Get(histoName1);
   TH1D* h2 = NULL; h2 = (TH1D*)f2->Get(histoName2);

   if (h1 == NULL || h2 == NULL) {
      printf("Histogram not found.\n");
      return;
   }

   TCanvas *c1 = new TCanvas("c1","transparent pad",10,10,1800,1100);

   gStyle->SetOptStat(11111111);
   gPad->SetGrid(1, 1);
   gPad->SetLogy();

   h1->SetLineColor(kBlue);
   h1->Draw();
   gPad->Update();
   TPaveStats *ps1 = (TPaveStats*)h1->GetListOfFunctions()->FindObject("stats");
   ps1->SetX1NDC(0.15); ps1->SetX2NDC(0.35);
   ps1->SetTextColor(kBlue);
   gPad->Modified();

   h2->SetLineColor(kRed);
   h2->Draw("][sames");
   gPad->Update();
   TPaveStats *ps2 = (TPaveStats*)h2->GetListOfFunctions()->FindObject("stats");
   ps2->SetX1NDC(0.65); ps2->SetX2NDC(0.85);
   ps2->SetTextColor(kRed);
   gPad->Modified();

   TString outFileName;
   outFileName.Form("%s/TwoExps.png", outFolder.Data());
   c1->SaveAs(outFileName);
}

It takes two files, which in my case have the same structure and contain results of the same analysis of two different sets of data, and plots a comparison plot of a certain histogram.
Everything works fine expect one feature - the stats in the second stat box do not change when I use TAxis::SetRangeUser to zoom in. Can this be fixed?

Can you provide a small reproducer we can run ?

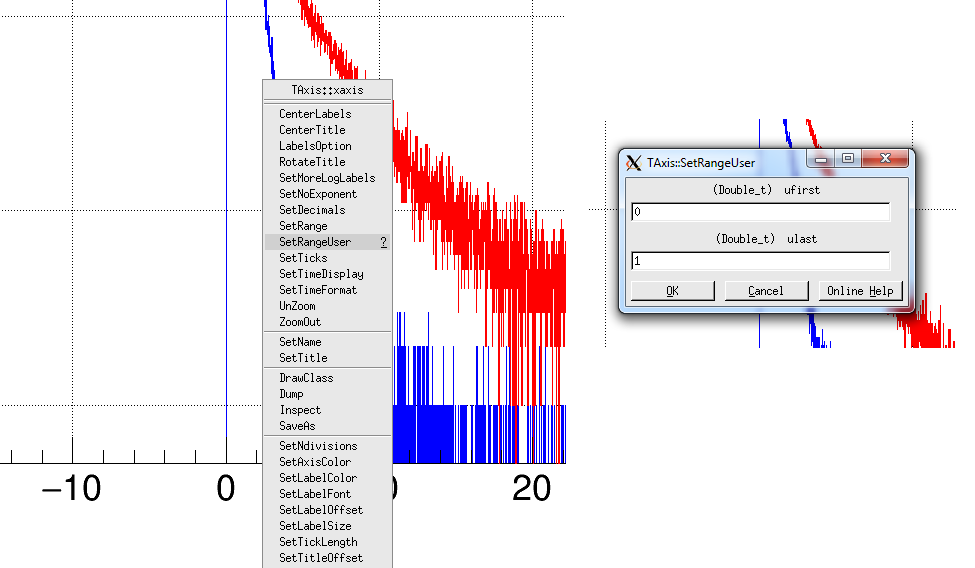
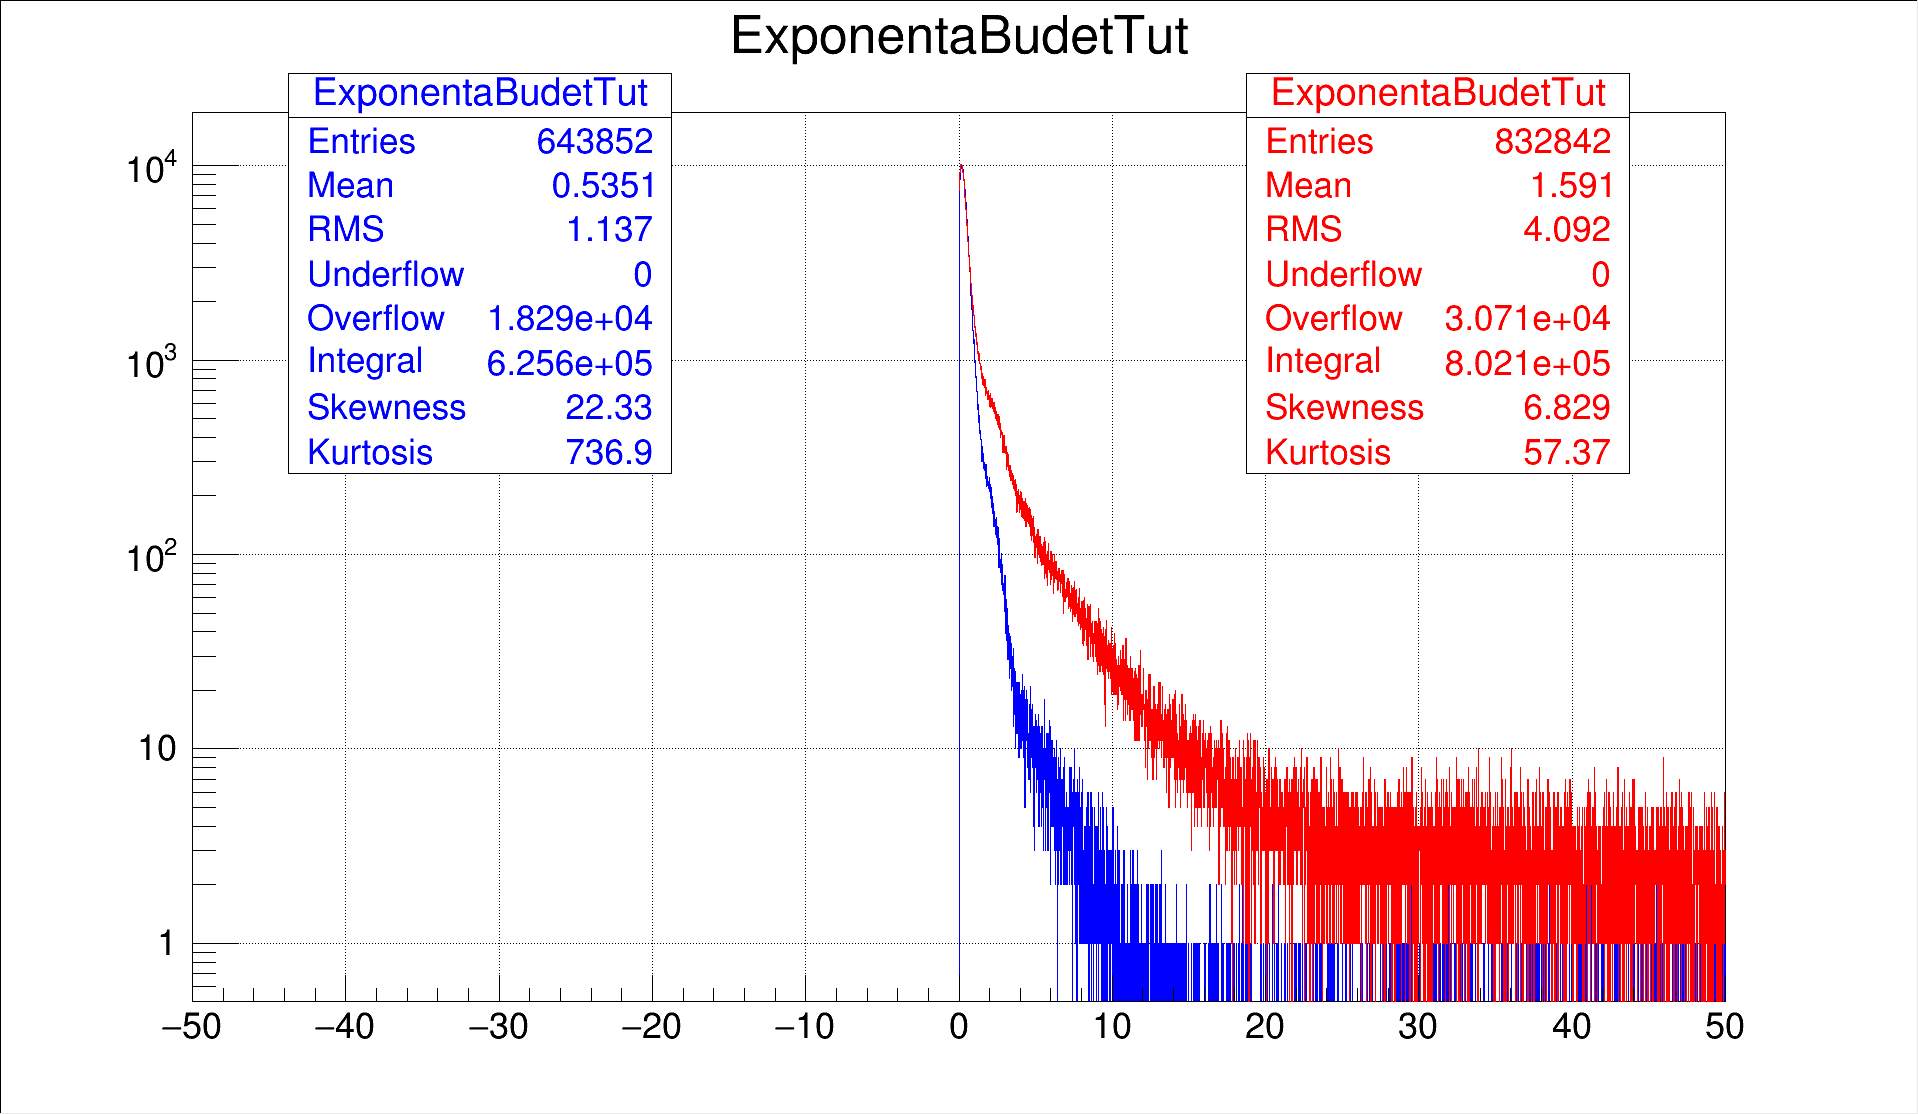
In the attachment there are two root files, a bit updated macro and what I see in my 5.34/25 ROOT before and after zooming. Note that the red stat box does not change though it should. I also accidentally noticed that if you zoom using drag-and-drop on the axis (hope you understand what I mean) then it works fine.


sum_WLS_off_G1.root (15.2 KB)
sum_WLS_on_G1.root (18.7 KB)


draw_two_exps.C (1.07 KB)

I do not see any such call in your macro.

Sure! I do that interactively - see screenshot. That’s the idea, get a pair of histograms from two files on one plot and then analyse it using interactive tools: play with the log/linear scale, zoom in/out, look at the mean/rms/integral, etc…

When I do it interactively by zooming with the mouse on the X xis I see the stats changing.
I tried with: 5.34/35 & 6.05/03

Yes, same for me. Now please look at the 1st screenshot in my second post. If I use SetRangeUser in the context menu then I experience the problem.

yes … I see it now …

You can reproduce it programmatically if you do the following in you macro:

[...]
   h1->SetLineColor(kBlue);
   h1->GetXaxis()->SetRangeUser(30.,40.);
[...]

The Mean of the blue histogram changes but not the one of the red histogram.

I guess the zoom on axis does something extra. Try also View->Editor… then click on the blue or the red histo and change the range going in the binning tab.