TTree plot branch of characters

Hi,

I am having trouble when trying to plot a TBranch of characters.

tree_act->Branch("position", position, "position/C");
tree_act->Branch("nth_v0", &nth_v0, "nth_v0/D");

I have this two branches and I want to plot them in a TH2 histogram, so I do as follows:

TH2F *pos_nthv0 = new TH2F("pos_nthv0", "nthv0 vs position", 4, 0, 4, 40, 710000, 950000);
pos_nthv0->SetMarkerStyle(26);
tree_act->Draw("nth_v0 : position >> pos_nthv0", "","");

The output that I get is in the plot attached.

unnamed.pdf (13 KB)

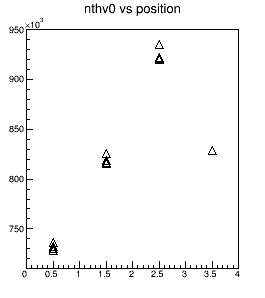
What I do not understand is why all the points related to the same value of position do not appear in the bin center (somwhow they are scattered randomly within the bin in the x axis).

If instead I would do:

tree_act->SetMarkerStyle(26); 
tree_act->Draw("nth_v0 : position", "");

They seem to be centered (although I would prefer to have them at 0.5, 1.5, 2.5,… instead of 0, 1, 2,…) but the axis label is not.

unnamed2.pdf (13 KB)

Could someone give me a clue of what I am doing wrong?

Thanks a lot,

paula

When you force an histogram in the TTree Draw command the resulting histogram is plotted. By default the SCAT option is used to plot this histogram, which is exactly what you said: random points in each cell. The number of points being proportional to the bin contain.

The effect you encounter can be clearly seen with the file hsimple.root generated by $ROOTSYS/tutorials/hsimple.C

root [1] ntuple->Draw("px:pz")

root [3] TH2F *h2 = new TH2F("h2","h2",10,-4,10,10,-3,3)
root [4] ntuple->Draw("px:pz>>h2")

I would recommend to use the 2nd way you mentioned in your post.

Thanks.

So then, if I use the second method, how can I make the first bin to be from 0, instead of 0.5 (so the value do not end up being on top of the y axis)? And how can I make the labels on the xaxis to be centered?

I think the best would be that you first Draw your 2D histogram empty to define the frame and then you draw the TTree using SAME:

hframe->Draw();
tree->Draw("x,y","","SAME") ;

anther alternative would be to use method #1 a with option GOFF and then Draw the 2D histogram with option COL or BOX. You will not get the market but the plot will look nice.

Let me know.

Also can you post a piece of code I can run to reproduce the problem ? … seems to me method #1 should work…

Hi,

I have tried what you suggested:

  1. goff option -> when I added the histogram is not even drawed. I do not know what I am doing wrong.
        TH2F *pos_nthv0 = new TH2F("pos_nthv0", "nthv0 vs position", 4, 0, 4, 40, 710000, 950000);
	can_nv->cd(1);
	pos_nthv0->SetMarkerStyle(26);
	tree_act->Draw("nth_v0 : position >> pos_nthv0", "","goff");
  1. if I first draw the empty histogram and then the TTree using Same, I lose the information of the xaxis and I get there instead the bin values:

tree_act->SetMarkerStyle(26); TH2F *pos_nthv0 = new TH2F("pos_nthv0", "nthv0 vs position", 4, 0, 4, 40, 710000, 950000); can_nv->cd(1); pos_nthv0->Draw(); tree_act->Draw("nth_v0 : position", "", "same");

  1. after tree->Draw do
    pos_nthv0->Draw(“COL”);

  2. Yes your histogram does not have the labels…

Provide me something I can run so I can debug that.

Hi again,

[quote]1. after tree->Draw do
pos_nthv0->Draw(“COL”);[/quote]

this worked. Still I would prefer the markers.

Find attached a test code for you to play with: test.c (1.59 KB)test.txt (170 Bytes)

Thank you for all the help.

I found the following way:

void test2(){
   char* position = new char[100];
   double nth_v0;

   TFile *file_test = new TFile("test_file.root", "RECREATE");
   TTree *tree_test = new TTree("tree_test", "tree_test");

   tree_test->Branch("position", position, "position/C");
   tree_test->Branch("nth_v0", &nth_v0, "nth_v0/D");

   ifstream fin_test("test.txt", ios::in);

   while (fin_test.good()){
      fin_test >> position >> nth_v0;
      tree_test->Fill();
   }

   TCanvas *can_nv = new TCanvas("can_nv", "nv Calculation", 0, 0, 850, 650);

   TH2F *pos_nthv0 = new TH2F("pos_nthv0", "nthv0 vs position", 4, 0, 4, 40, 710000, 950000);
   pos_nthv0->SetMarkerColor(0);
   tree_test->Draw("nth_v0 : position >> pos_nthv0","","");
   tree_test->SetMarkerStyle(26);
   tree_test->Draw("nth_v0 : position","","same");
}

Thank you so much! It is exactly what I wanted :smiley:

Just one last (probably trivial) question:

if now I write and close the root file, later when I open the root file and visualize the histogram the only histogram that appears is the first one plotted using

but not the

Do you know how can I do it that I get to save both histograms together?

Inded the 2nd is not an histogram but the TTree.
Save the canvas instead of the histogram

Yes. I can save the canvas, but the histogram is implicitly saved as well. How can I do not to save the histogram, then?

your plot consists of 2 objects: an histogram for the axis and then the tree plot for the dots. If you want to keep all in a single entity your need to save the canvas.

Yes.

But what I meant is that now in my root file I will have a “wrong” histogram and a complete canvas with all the information I need. I was wondering if there is a way not to save the histogram (since i do not need it).

Thanks.

Yes … just write the canvas in the file and not the histogram … I am not sure I understand your problem …

mmm. Maybe I am messing up. But as soon as I create a histogram it is saved into the root file, without needing to write it specifically.

Try this new macro:

void test2(){
   char* position = new char[100];
   double nth_v0;

   TFile *file_test = new TFile("test_file.root", "RECREATE");
   TTree *tree_test = new TTree("tree_test", "tree_test");

   tree_test->Branch("position", position, "position/C");
   tree_test->Branch("nth_v0", &nth_v0, "nth_v0/D");

   ifstream fin_test("test.txt", ios::in);

   while (fin_test.good()){
      fin_test >> position >> nth_v0;
      tree_test->Fill();
   }

   TCanvas *can_nv = new TCanvas("can_nv", "nv Calculation", 0, 0, 850, 650);

   TH2F *pos_nthv0 = new TH2F("pos_nthv0", "nthv0 vs position", 4, 0, 4, 40, 710000, 950000);
   pos_nthv0->SetMarkerColor(0);
   tree_test->Draw("nth_v0 : position >> pos_nthv0","","");
   tree_test->SetMarkerStyle(26);
   tree_test->Draw("nth_v0 : position","","same");

   can_nv->SaveAs("can_nv.root"); // <<<<<<<<<<<<<<<<<<<
}

and then:

root [0] TFile a("can_nv.root");
root [1] a.ls()
TFile**		can_nv.root	
 TFile*		can_nv.root	
  KEY: TCanvas	can_nv;1	nv Calculation
root [2] can_nv->Draw()

Actually, I found what I need it:

Thanks a lot!