Hi All,
I have a quite hard time to understand how graphics work in root. Eventhough I use it for years now and even wrote GUIs with it I run into basic problems which I do not understand.
So I thought I read through the graphics chapter and start from the very basics.
So, for my understanding could someone please look at the following plots:
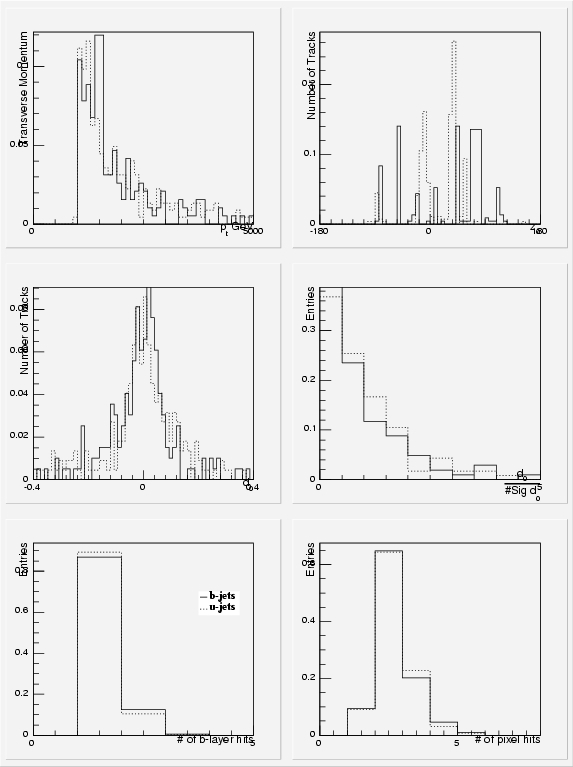
Plot “withMargin.jpg”: canvas divided into 6 subcanvases and obviously a gab between them.
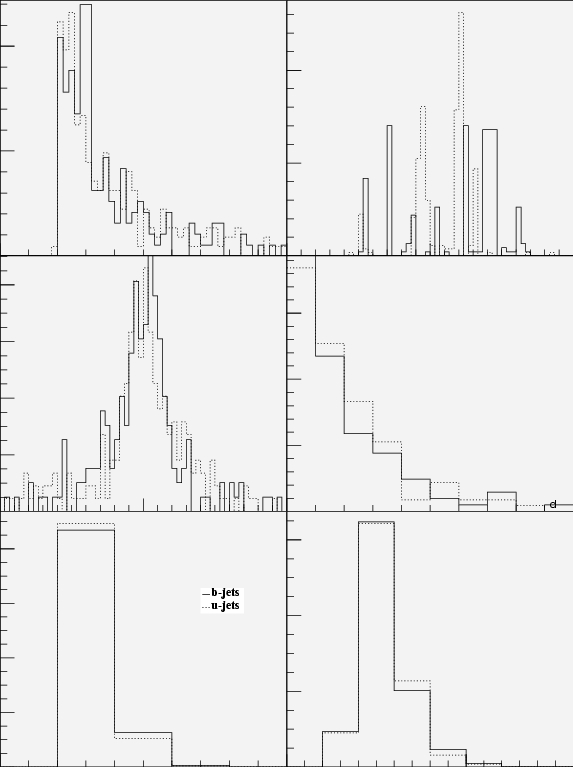
Plot “withOutMargin.jpg”: the root manual says one can use TCanvas::Divide(2,3,0.,0.) where the last two numbers define how big this gap is
Now, naively I thought with 0., 0. the gap vanishes - and so it does - but so does everything but the plain histogram … axis title - gone, label - gone, …
I do not at all understand how root treats margins and borders aso. I tell it to have 0. gap between pads and everything disappears but the plain histogram … so it seems some margins inside the pad have changes now as well …
I remember in the short and long ago times when I used PAW there was one big plot explaining all margins and varibles for font offsets aso. does something like that exist for root?
Cheers
Andi