Dear experts,
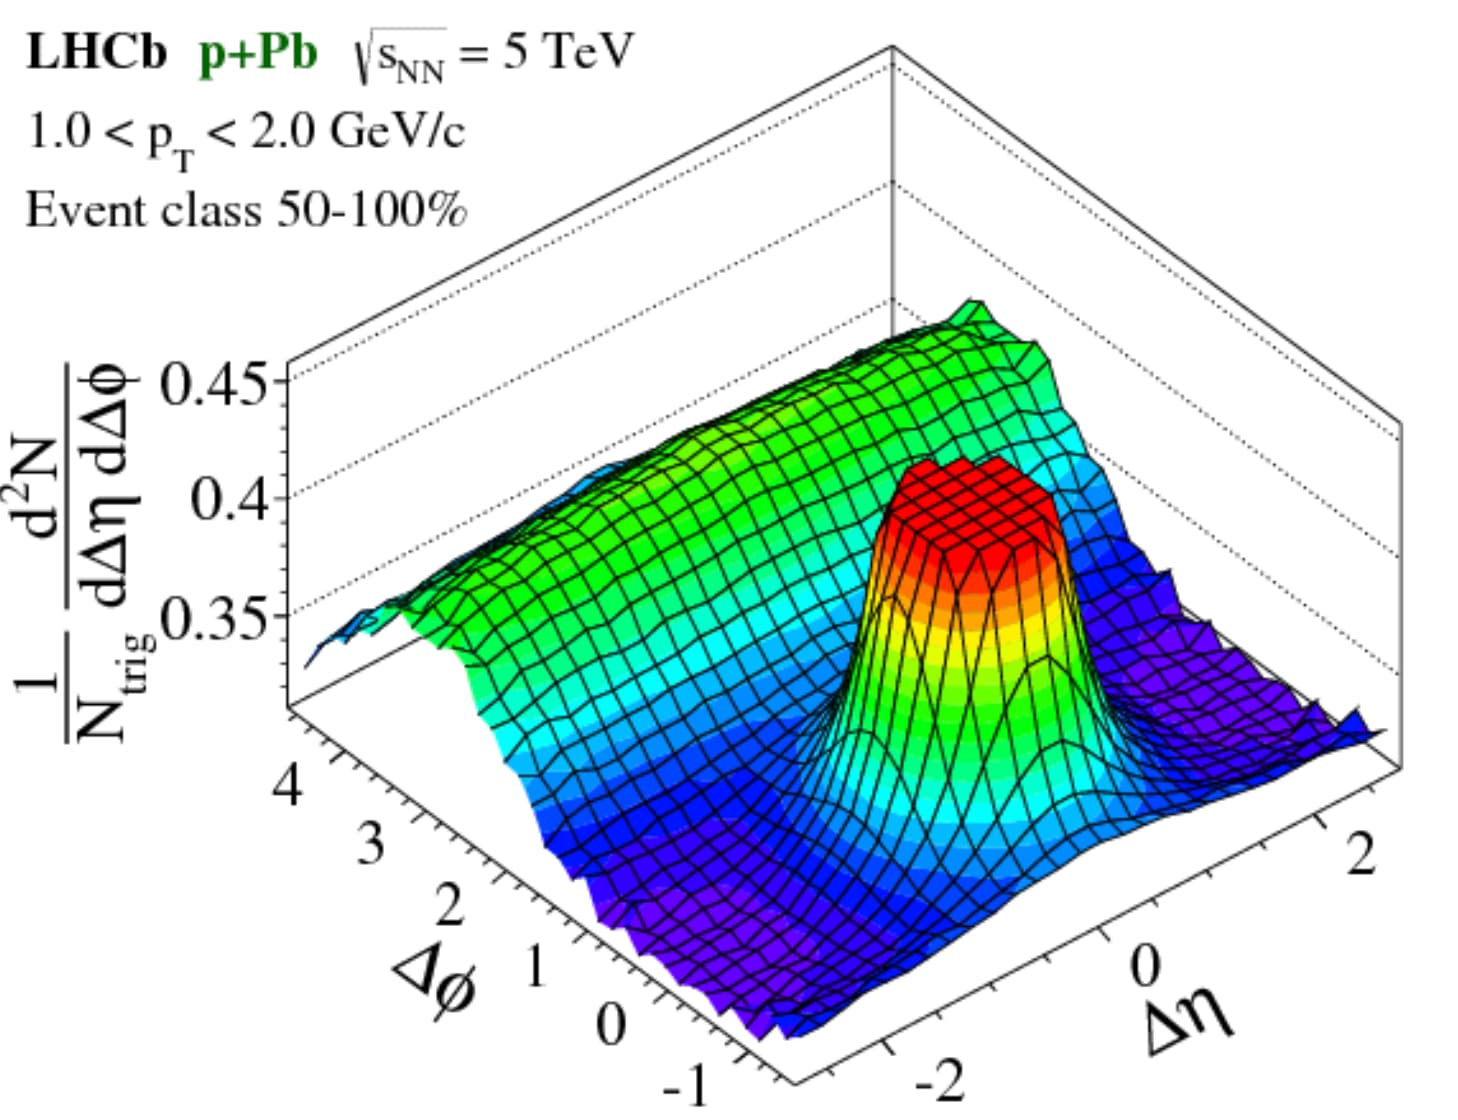
Could you share how the peak (Deta~0, Dphi~0) is truncated for one 2D histogram? Just like the picture I showed. Actually, I tried to set the range at the z-axis, seemly it doesn’t work;
Best regards
Liuyao.
Set the maximum to something high h->SetMaximum(..) if it is still truncated it means your histogram has been filled like that. If not adjust the maximum to a reasonable value.
Dear Couet,
Great, I checked, and worked well;
Thanks for your prompt reply;
Best
Liuyao.