I’ve started to learn about RooFit and trying to use it but I already ran into some trouble I don’t seem to understand. The TH1 histogram I’m importing onto the RooPlot frame in form of a RooDataHist isn’t showing properly on the frame.
RooRealVar Obs("Obs", "Obs", expected_value - dE, expected_value + dE);
What is dE here? It looks like an error on the expected value, but the lower and upper uncertainties is not what the RooRealVar constructor expects. You need to pass the definition range for the variable, which should probably match with the histogram limits:
Then it should work. Probably, your dE was very small, so the definition range was very narrow and all the values clipped to the first bin like you saw in the plot.
Cheers,
Jonas
edit: fixed copy-paste error, using GetXmin() for lower limit
Hi again, sorry for the late response.
First I want to thank you for your response.
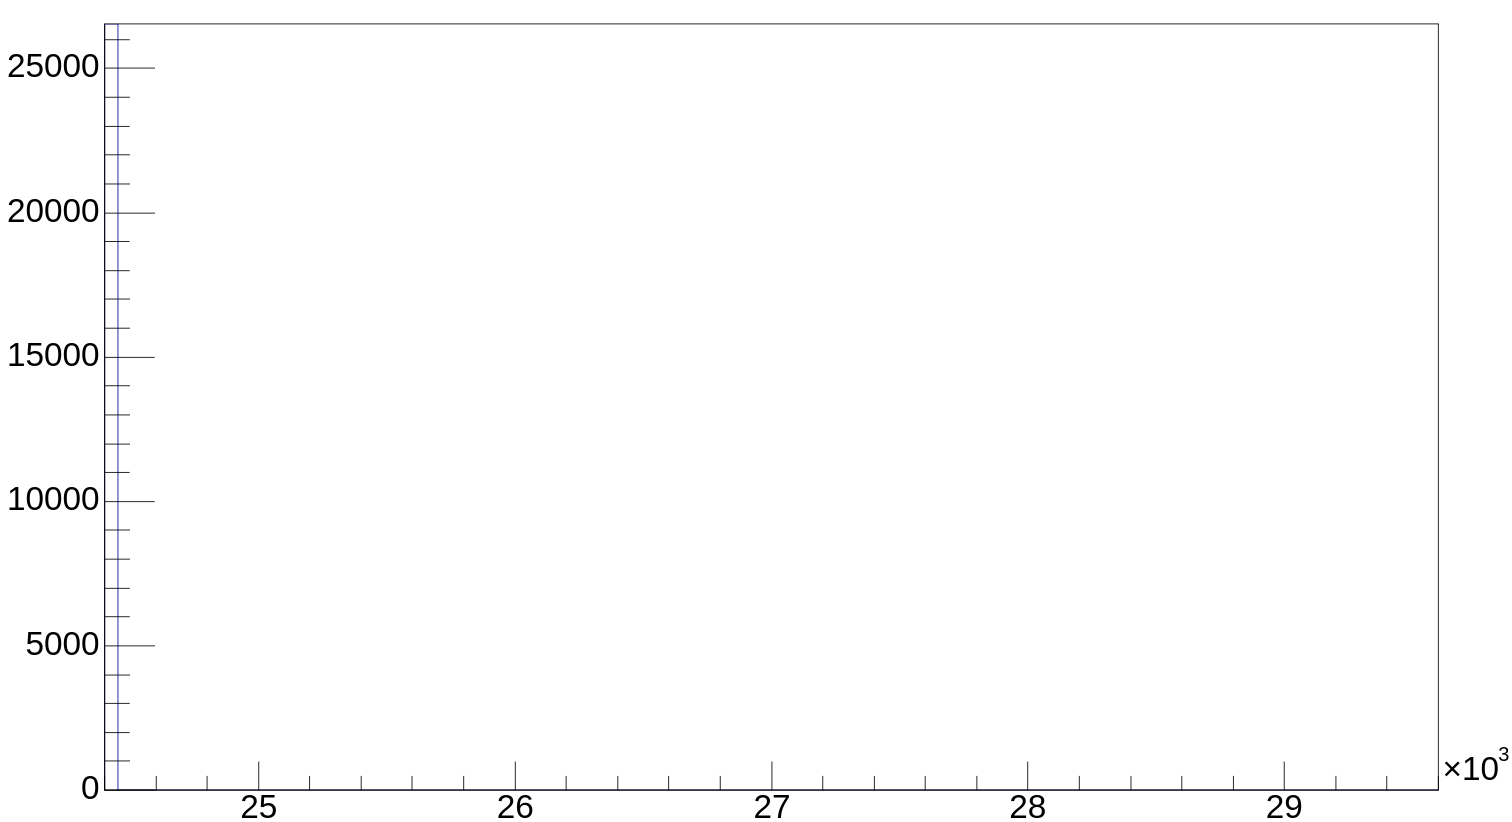
I tried your approach but the values still clipps to the first bin ( I changed the first GetXmax into a GetXmin too ). It also appears that not all the values are stored in this bin and the width of the one bin doesn’t match the width of the bins of the original historgram (in the original it’s 10 units per bin; in the rooplot it has 350 units per bin). Do you have another idea eventually?
Here is by the definition of my function that I use to create the TFile (should have posted it earlier…)
void FitHistogram_ROOFIT(TH1 *histo, const double dE, const double expected_value, const uint8_t index )
I found the solution for my problem. I was using the Rootfile Viewer in VSCode to look at the RooFit frames (without a TCanvas that was defined in my code). This lead to the peculiar problem. Looking at the TBrowser, the data looks completely fine. So does it in the Rootfile Viewer with a defined TCanvas.