Hello,
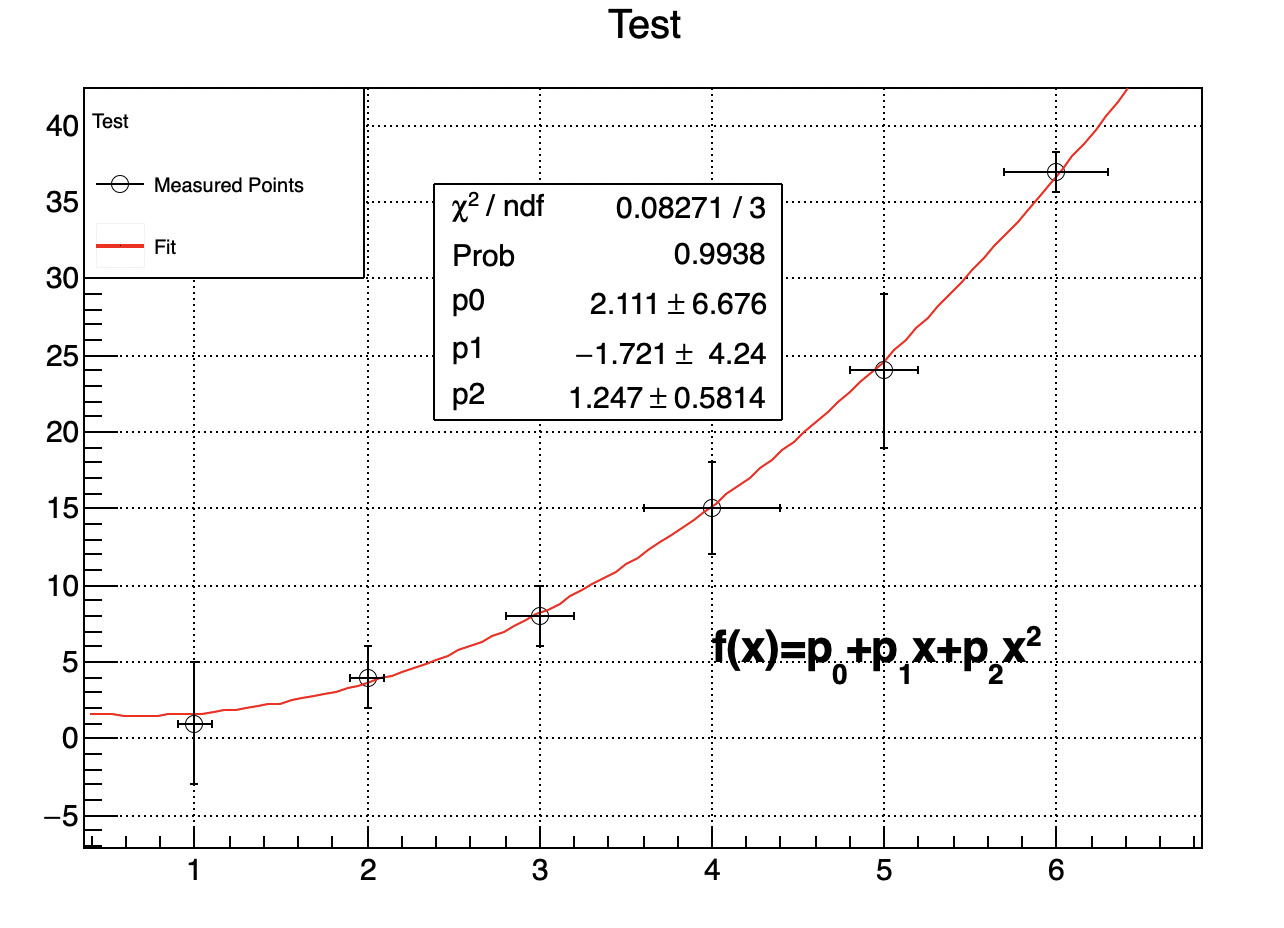
I am trying to display the fit statistics for a fitted graph using gStyle->SetOptFit(1111);, but for some reason, the fit stats are not displaying on the graph.
test.cxx (1.5 KB)
data.txt (59 Bytes)
ROOT Version: 6.23
void test(){
   gStyle->SetOptFit(1111);
   auto  c = new TCanvas();
   c->SetGrid();

   auto graph = new TGraphErrors("./data.txt","%lg %lg %lg %lg");
   graph->SetMarkerStyle(kCircle);
   graph->SetFillColor(0);
   graph->SetTitle("Test");
   graph->Draw("PEA");

   auto g = new TF1("Quadratic Fit","[0]+[1]*x+[2]*x**2",0.,10.);
   g->Print();
   g->SetParameters(0,0,1);
   g->SetLineColor(kRed);

   graph->Fit(g,"M","",0.,10.);
   graph->Print();


   auto leg = new TLegend(.1,.7,.3,.9,"Test");
   leg->SetFillColor(0);
   leg->AddEntry(graph,"Measured Points");
   leg->AddEntry(g,"Fit");
   leg->Draw();

   auto text = new TLatex(4.,5.,"f(x)=p_{0}+p_{1}x+p_{2}x^{2}");
   text->Draw();

   gPad->Update();
   TPaveStats *ps = (TPaveStats*)graph->GetListOfFunctions()->FindObject("stats");
   ps->SetX1NDC(0.35);
   ps->SetX2NDC(0.6);
   ps->SetY1NDC(0.55);
   ps->SetY2NDC(0.8);
   gPad->Modified();
   gPad->Update();
}
Thank you very much!