Dear Rooters,
I encountered some weird results while trying to construct some ratio plots using the TRatioPlot class. I’m using pyroot to construct histograms from lists/numpy arrays and, depending on how I define the bin contents, I get some pretty weird results. Consider this example:
arr1 = np.array([1,2,3,4])
arr2 = 1.5 * arr1
h1 = ROOT.TH1D( ROOT.TVectorD(len(arr1),arr1.astype(np.float64)) )
h2 = ROOT.TH1D( ROOT.TVectorD(len(arr2),arr2.astype(np.float64)) )
rpl = ROOT.TRatioPlot( h1, h2 )
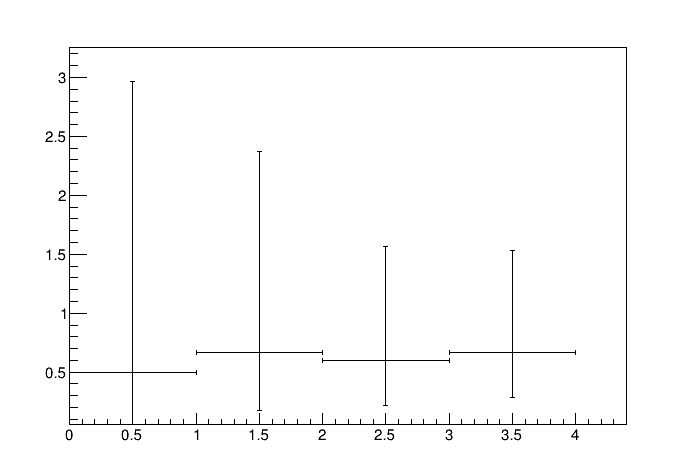
ri = rpl.GetCalculationOutputGraph()
c=ROOT.TCanvas()
ri.Draw('ap')
c.Draw()
Now, I understand that the default method used is the TGraphAsymmErrors::Divide function which tries to estimate an efficiency rather than calculate the simple ratio. If I wanted to calcluate the latter I can use the “divsym” option in TRatioPlot and get a constant 0.6666… as one would expect. What irks me is that the result of the default calculation of the ratio depends on the values of the histogram bin errors. This detail is particularly hard to spot as the result with and without the ‘divsym’ option is identical in most other cases – eg. when the histogram bin contents are integer numbers. I believe most users wanting to use the TRatioPlot would incorrently assume that it only uses the histogram bin contents to calculate the ratio. I suggest there should be a sentence added to the documentation to help other users avoid this pitfall.
Cheers,
Alex
ROOT Version: 6.26
Platform: linux
Compiler: Not Provided