TRatioPlot (a few questions)

Hello,

I am trying to build a TRatioPlot. Its mostly successful. I have a THStack and some data. All displayed.

The issue is I want to add a title (something like "Preliminary Result ; Luminosity ; Channel "). I cant seem to figure out how to add this title to the plot. I have tried adding it to the upper plot but its not worked.

The other thing is I want to add in a checked histogram (or region between an upper and lower histogram) to represent some uncertainty on my backgrounds. I know of a number of ways to do this on an ordinary histogram, is there an easy way to add something like this to the TRatioPlot?

Thanks for any help


Please read tips for efficient and successful posting and posting code

ROOT Version: Not Provided
Platform: Not Provided
Compiler: Not Provided


It should be no problem to add a TText or a TLatex on your plot. Can you post what you did already ?

It should be similar. Again can you provide an example ?

This is the snippet of code. All the plots labelled things like tau_plot_M_weighted are just TH1F’s.

I think the issue is that when the canvas appears the label is not visible. When I save it as say a PDF the label appears but its in completely the wrong place or the wrong size (since I can’t see it on the canvas when I’m interactive). I think this problem can be overcome with some trial and error. Currently I am using the Legend Header for the information.

The background histogram is the issue. Since its a THStack + a TH1F (the data). I can do something to make the upper limit (add a final histogram to the stack with the additonal + error bin content) but I’m not sure how to add in the lower limit since normally I would fill an area between two TH1F’s and this doesnt seem to be possible because adding a simple TH1F ontop of the THStack+TH1F plot isnt working. The data TH1F is added automatically because its involved with the ratio.

 TCanvas *c9 =  new TCanvas();
  tau_plot_M_weighted->SetFillColor(kBlue);
  tauD_plot_M_weighted->SetFillColor(kViolet-10);
  uds_plot_M->SetFillColor(kMagenta);
  cc_plot_M->SetFillColor(kOrange);
  mumu_plot_M->SetFillColor(kRed-7);
  b0b0_plot_M->SetFillColor(kGreen);
  bpbm_plot_M->SetFillColor(kGray);
  Background_M->SetFillStyle(3144);
  tau_plot_M_weighted->SetLineColor(kBlue);
  tauD_plot_M_weighted->SetLineColor(kViolet-10);
  uds_plot_M->SetLineColor(kMagenta);
  cc_plot_M->SetLineColor(kOrange);
  mumu_plot_M->SetLineColor(kRed-7);
  b0b0_plot_M->SetLineColor(kGreen);
  bpbm_plot_M->SetLineColor(kGray);
  Background_M->SetFillColor(kBlack);
  Background_M->SetLineColor(kBlack);
  c9->cd();
  THStack *Mh = new THStack("Mh ","Mh ");
  Mh->Add(mumu_plot_M);
  Mh->Add(b0b0_plot_M);
  Mh->Add(uds_plot_M);
  Mh->Add(bpbm_plot_M);
  Mh->Add(cc_plot_M);
  Mh->Add(tauD_plot_M_weighted);
  Mh->Add(tau_plot_M_weighted);
  Mh->Draw("histsame");
  auto rp9 = new TRatioPlot(Mh, data_plot_M);
  rp9->GetXaxis()->SetTitle("m_{h} [GeV]");
  rp9->Draw("same");
  rp9->GetLowerRefYaxis()->SetTitle("MC/Data");
  rp9->GetUpperRefXaxis()->SetTitle("m_{h}");
  rp9->GetUpperRefYaxis()->SetTitle("Entries");
  gPad->Modified();
  gPad->Update();
  TPad *p9 = rp9->GetUpperPad();
  auto leg9 = p9->BuildLegend(0.1,0.7,0.48,0.9, "","f");
  rp9->GetUpperPad();
  /*auto *th3 = new TText(0.9,0.823,"Preliminary");
  th3->SetTextAlign(31); th3->SetTextSize(0.5);
  th3->Draw();*/
  leg9->SetHeader(LegendTitle,"L");
  leg9->AddEntry(data_plot_M,"data","pl");
  p9->Modified(); 
  p9->Update();
  c9->Draw();

Can you post something we can run ?

Sure, here is a simple example to replicate the issues:

void MakeRatio(){
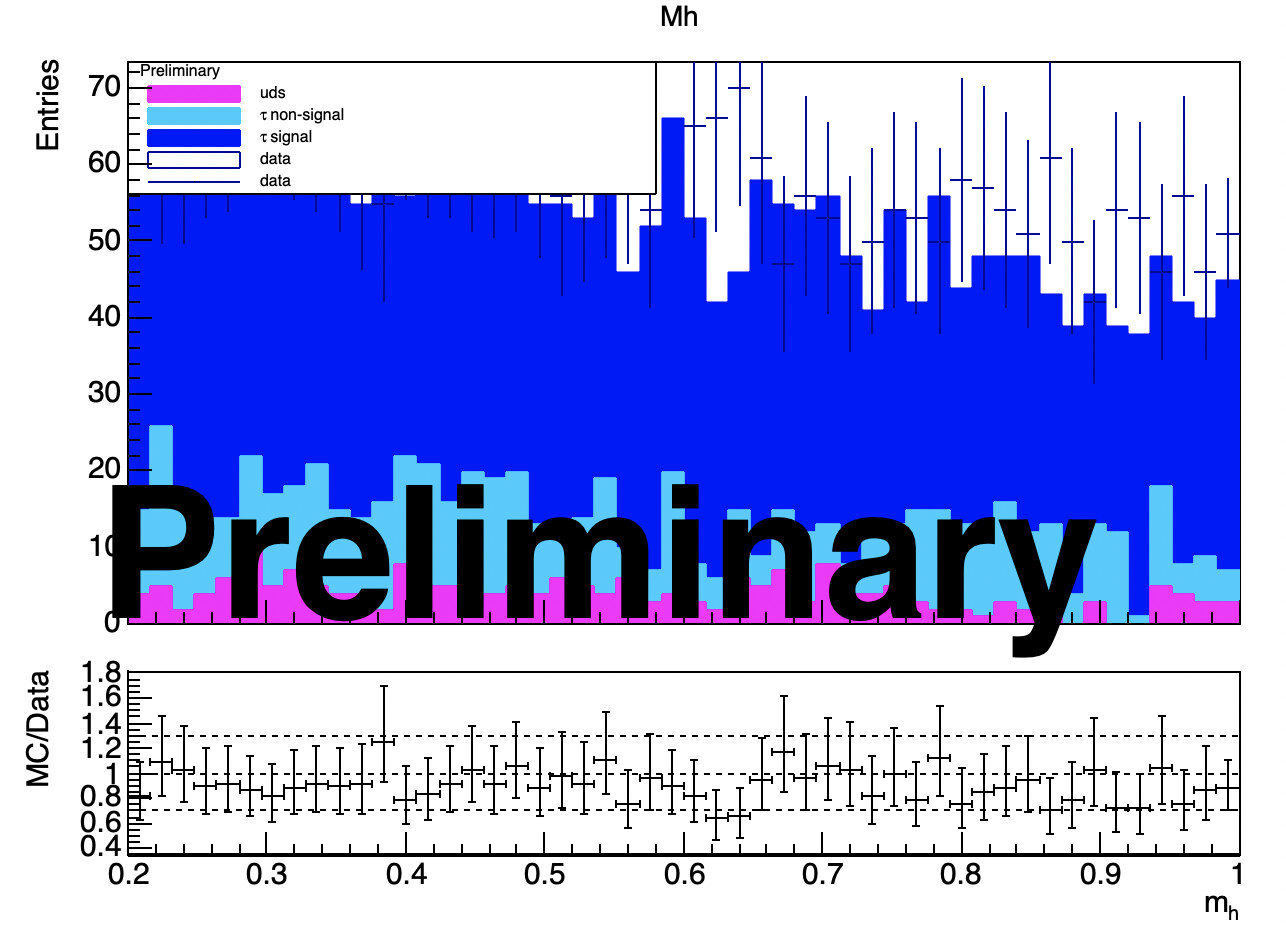
  TString LegendTitle = "Preliminary";
  TH1F *uds_plot_M = new TH1F("uds M", "uds", 50,  0.2,1);
  TH1F *Background_M = new TH1F("Backg. Unc.", "Backg. Unc.", 50,  0.2,1);
  TH1F *tau_plot_M_weighted  = new TH1F("#tau M", "#tau signal", 50,  0.2,1);
  TH1F *tauD_plot_M_weighted  = new TH1F("#tau M", "#tau non-signal", 50,  0.2,1);
  TH1F *data_plot_M = new TH1F("data", "data", 50, 0.2,1);

  uds_plot_M->FillRandom("gaus",200);
  tau_plot_M_weighted->FillRandom("gaus",2000);
  tauD_plot_M_weighted->FillRandom("gaus",500);
  data_plot_M->FillRandom("gaus",3000);
  for(int bin=0; bin<data_plot_M->GetNbinsX(); bin++){
    double content = data_plot_M->GetBinContent(bin);
    double newcontent = (0.1)*content;
    Background_M->SetBinContent (bin, newcontent);
    data_plot_M->SetBinError(bin,0.1*content+sqrt(content));
  }


  TCanvas *c9 =  new TCanvas();
  tau_plot_M_weighted->SetFillColor(kBlue);
  tauD_plot_M_weighted->SetFillColor(kViolet-10);
  uds_plot_M->SetFillColor(kMagenta);
  Background_M->SetFillStyle(3144);
  tau_plot_M_weighted->SetLineColor(kBlue);
  tauD_plot_M_weighted->SetLineColor(kViolet-10);
  uds_plot_M->SetLineColor(kMagenta);
  Background_M->SetFillColor(kBlack);
  Background_M->SetLineColor(kBlack);

  c9->cd();
  THStack *Mh = new THStack("Mh ","Mh ");
  Mh->Add(uds_plot_M);
  Mh->Add(tauD_plot_M_weighted);
  Mh->Add(tau_plot_M_weighted);
  //Mh->Add(Background_M); Option 1 (works but no lower limit)
  Mh->Draw("hist");
  auto rp9 = new TRatioPlot(Mh, data_plot_M);
  rp9->GetXaxis()->SetTitle("m_{h} [GeV]");
  rp9->Draw("same");
  rp9->GetLowerRefYaxis()->SetTitle("MC/Data");
  rp9->GetUpperRefXaxis()->SetTitle("m_{h}");
  rp9->GetUpperRefYaxis()->SetTitle("Entries");
  gPad->Modified();
  gPad->Update();
  TPad *p9 = rp9->GetUpperPad();
  Background_M->Draw("histsame"); //Option2 (doesnt work) - would need to change bin content to make this work for real obviously!
  auto leg9 = p9->BuildLegend(0.1,0.7,0.48,0.9, "","f");
  rp9->GetUpperPad();
  auto *th3 = new TText(0.9,0.823,"Preliminary");// TODO: This doesnt show up opn top pad
  th3->SetTextAlign(31); th3->SetTextSize(0.5);
  th3->Draw();
  leg9->SetHeader(LegendTitle,"L");
  leg9->AddEntry(data_plot_M,"data","pl");
  p9->Modified();
  p9->Update();
  c9->Draw();
}

You can see for the background issue I tried 2 options. Option 1 gives me that upper limit but no way of getting the lower. Option 2 is preferable and would lead to me adding a second for the lower limit, nothing is added to the canvas when Option 2 is used. I also have the added Text option to show how that issue is occurring.

Let’s start form a cleaned-up macro:

void MakeRatio(){
   TH1F *uds_plot_M = new TH1F("uds M", "uds", 50,  0.2,1);
   TH1F *Background_M = new TH1F("Backg. Unc.", "Backg. Unc.", 50,  0.2,1);
   TH1F *tau_plot_M_weighted  = new TH1F("#tau M", "#tau signal", 50,  0.2,1);
   TH1F *tauD_plot_M_weighted  = new TH1F("#tau M", "#tau non-signal", 50,  0.2,1);
   TH1F *data_plot_M = new TH1F("data", "data", 50, 0.2,1);

   uds_plot_M->FillRandom("gaus",200);
   tau_plot_M_weighted->FillRandom("gaus",2000);
   tauD_plot_M_weighted->FillRandom("gaus",500);
   data_plot_M->FillRandom("gaus",3000);

   for (int bin=0; bin<data_plot_M->GetNbinsX(); bin++) {
      double content = data_plot_M->GetBinContent(bin);
      double newcontent = (0.1)*content;
      Background_M->SetBinContent (bin, newcontent);
      data_plot_M->SetBinError(bin,0.1*content+sqrt(content));
   }

   TCanvas *c9 =  new TCanvas();
   tau_plot_M_weighted->SetFillColor(kBlue);
   tauD_plot_M_weighted->SetFillColor(kViolet-10);
   uds_plot_M->SetFillColor(kMagenta);
   Background_M->SetFillStyle(3144);
   tau_plot_M_weighted->SetLineColor(kBlue);
   tauD_plot_M_weighted->SetLineColor(kViolet-10);
   uds_plot_M->SetLineColor(kMagenta);
   Background_M->SetFillColor(kBlack);
   Background_M->SetLineColor(kBlack);

   THStack *Mh = new THStack("Mh ","Mh ");
   Mh->Add(uds_plot_M);
   Mh->Add(tauD_plot_M_weighted);
   Mh->Add(tau_plot_M_weighted);

   auto rp9 = new TRatioPlot(Mh, data_plot_M);
   rp9->Draw();

   rp9->GetLowerRefYaxis()->SetTitle("MC/Data");
   rp9->GetUpperRefXaxis()->SetTitle("m_{h}");
   rp9->GetUpperRefYaxis()->SetTitle("Entries");

   auto leg9 = rp9->GetUpperPad()->BuildLegend(0.1,0.7,0.48,0.9, "","f");
   leg9->SetHeader("Preliminary","L");
   leg9->AddEntry(data_plot_M,"data","pl");

   rp9->GetUpperPad()->cd();
   auto *th3 = new TText(0.9,0.823,"Preliminary");// TODO: This doesnt show up opn top pad
   th3->SetTextAlign(31); th3->SetTextSize(0.3);
   th3->Draw();
}

It gives:

Let me know if it is not ok yet.

Thanks , yes this works, it gives the label as you show there which I can now resize and move on my real plot. I still dont see any extra histograms, I guess thats the next step

Let me know what you want to see as extra…

This topic was automatically closed 14 days after the last reply. New replies are no longer allowed.