I would like to create a plot where I only have black line (and text) on a transparent background. So when I create a eps-file from the plot and include that in a latex file that has other drawings in the background, I can still see those drawings behind the plotted histogram.
I’ve tried to use:
gStyle->SetPadColor(4000)
gStyle->SetCanvasColor(4000)
gStyle->SetHistFillColor(4000)
histogram->SetFillColor(4000)
c1->SetFrameFillColor(4000)
c1->SetFillColor(4000)
But when I’ve plotted the histogram and used the save as… function to create a eps-file, I get the error messages:
Warning in TGX11TTF::SetColor: color with index 4000 not defined
Warning in TGX11TTF::SetColor: color with index 4000 not defined
Warning in TGX11TTF::SetColor: color with index 4000 not defined
and the resulting eps file still has a white background and is not transparent.
So what am I doing wrong?
Thanks.
Okay, I’ve downloaded the ps-file, converted it into eps, included it into a latex file to create an new ps file with the eps-file in front of other stuff and it is not transparent. I know how I can make the pad transparent so that I can draw different histograms on top of each other in root, but I want to be able to get an eps-file that is still transparent, so in the eps file, the pad (that is grey with the default values) should be transparent.
Hi vaubee,
I have also been trying to learn how to do this! See… root.cern.ch/phpBB2/viewtopic.php?t=1837
I have tried the previous suggestions and they do not work. I think that you have phrased the problem better then I. How do you get access to the background pad for a histogram drawn on a canvas? If we get access to the right pad we can SetFillStyle(4000), and it should be trasparent.
I’ve seen the thread where you’ve tried to get an answer, which is why I’ve tried to formulate the problem in a different way. The last post actually help a little. I know now that using the TCanvas::SetFillStyle(4000) gives me a plot that has a transparent background, but the inner part of the histogram is still filled with a white background. Using TCanvas::cd()->SetFillStyle(4000) to change the pad to being transparent doesn’t help, nor does TH1F::SetFillStyle(4000). So there has to be some other object besides the histogram and the pad, that is being painted just behind the histogram.
When I right-click into this region, I get a menu with the Title TFrame, so I’ve also tried to use TCanvas::SetFrameFillStyle(4000), but that didn’t help either.
Clearly I’m at a loss at what to do now.
Okay, that post was a little bit to early, I think I’ve found the solution:
{
TCanvas *c1 = new TCanvas(“c1”,“transparent pad”,200,10,700,500);
c1->SetFillStyle(4000);
c1->SetFrameFillStyle(4000);
TPad *pad1 = new TPad(“pad1”,"",0,0,1,1);
pad1->SetFillStyle(4000); //will be transparent
pad1->SetFrameFillStyle(4000);
pad1->Draw();
pad1->cd();
TH1F* h = new TH1F(“h”,“h”,100,-5,5);
h->FillRandom(“gaus”);
h->SetFillStyle(4000);
h->Draw();
pad1->Update(); //this will force the generation of the “stats” box
pad1->Modified();
c1->cd();
}
I’ve attached the saved .eps file and also a .ps file that I’ve created in latex using said .eps file. I’ve had to rename the .eps file to .C since I couldn’t upload it otherwise (why??) test.C (11.7 KB) test.ps (45.2 KB)
but when I include the saved histogram file into a LaTeX document the pad is not transparent.
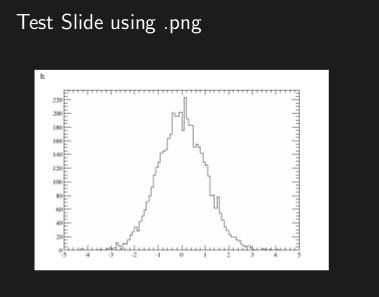
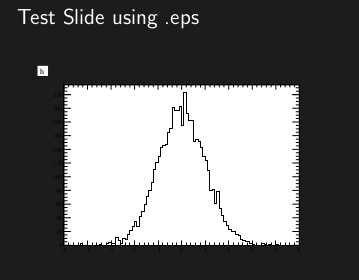
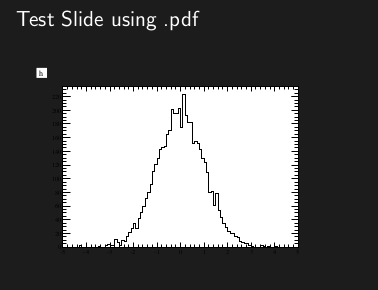
Attached is a small macro attempting to produce the desired output, and 3 images showing that none of the output files give the desired result (transparent histogram/pad background).
The canvases (i.e. the area surrounding the axes titles and labels) are transparent for .eps and .pdf files.
But the pad (interior area) is still solid white.
Unfortunately, I don’t see the transparency in your attached files because your background is white.
I’ve attached a modified .tex file which has a yellow background, and the pad created with your macro is still solid white. The histogram file you attached also appears white in the resulting .pdf file created with pdflatex. transtex.tex (234 Bytes) transtex.pdf (23.6 KB)
root [0] .x trans.C
Info in <TCanvas::Print>: pdf file trans.pdf has been created
Info in <TCanvas::Print>: eps file trans.eps has been created
Info in <TCanvas::Print>: file trans.png has been created
root [1] .q
$ pdflatex transtex.tex
and I get the attached file. As you see we can see canvas is transparent. You can see the yellow background of the Latex page. transtex.pdf (23.6 KB)
Yes, your result is exactly what I am trying to do. But unfortunately it’s not working on my machine, I get the result in attachment. I’m not sure what the problem is.
Do you have any suggestions on what to look for? Thanks!
I just ran again le macro with root 6 … I get the exact same plot as before… it works for me…
can you generate the PS (trans.ps) ? and send it to me … (olivier.couet@cern.ch)