ROOT 6.12/07 ----- pyROOT
Hello,
I have pairs of histograms and each member of the pair has the same number of bins, but with different ranges.
Some times one’s range is completely inside the other, sometimes they overlap a little, and sometimes they do not.
What I want to do is to transform the histograms so that for both, the new range is
new_min = min(h1.GetXaxis().GetXmin(), h2.GetXaxis().GetXmin())
new_max = max(h1.GetXaxis().GetXmax(), h2.GetXaxis().GetXmax())
and they have the same number of bins nbins.
The reason for this operation is that eventually these histos will be divided.
I have made a function that tries to do that but probably the .SetBins(nbins, new_min, new_max) method is not doing what I think it should. The implementation considers an arbitrary ammount of bins.
import ROOT as rt
def same_binning(nbins, *histos):
"""
Make all histos have the same binning and range
"""
# Get the maximum and minimum of x axis of all histos
# Initialize min and max with values that will definately get overwriten
min = 1e50
max = -1e10
for histo in histos:
if (histo.GetXaxis().GetXmin() < min):
min = histo.GetXaxis().GetXmin()
if (histo.GetXaxis().GetXmax() > max):
max = histo.GetXaxis().GetXmax()
# Make all histos have the same binning and range
for histo in histos:
histo.SetBins(nbins, min, max)
# create dummy histos
h1 = rt.TH1F("h1", "h1", 100, 0, 10)
h2 = rt.TH1F("h2", "h2", 100, 1.998, 2.002)
# fill dummy histos with gaussians, exact shape doesn't matter
h1.FillRandom("gaus", 1000)
h2.FillRandom("gaus", 1000)
h2.SetLineColor(rt.kRed)
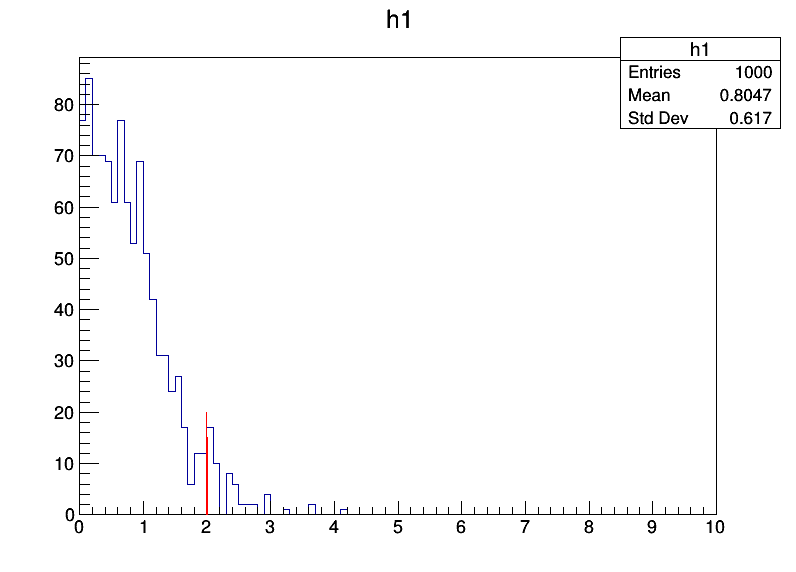
# plot dummy histos
c = rt.TCanvas("c", "c", 800, 600)
h1.Draw("same")
h2.Draw("same")
c.SaveAs("dummy_histos.png")
# make dummy histos have the same binning
same_binning(100, h1, h2)
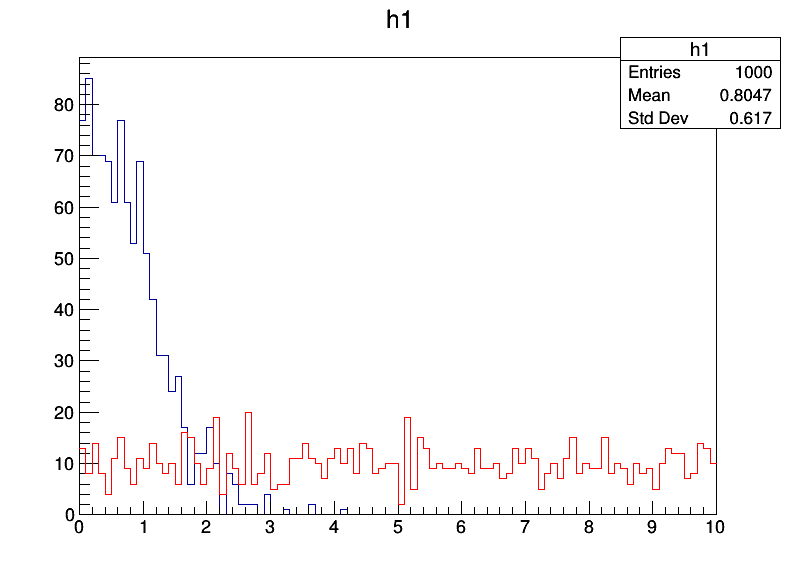
# plot dummy histos with same binning
c = rt.TCanvas("c", "c", 800, 600)
h1.Draw("same")
h2.Draw("same")
c.SaveAs("dummy_histos_same_binning.png")
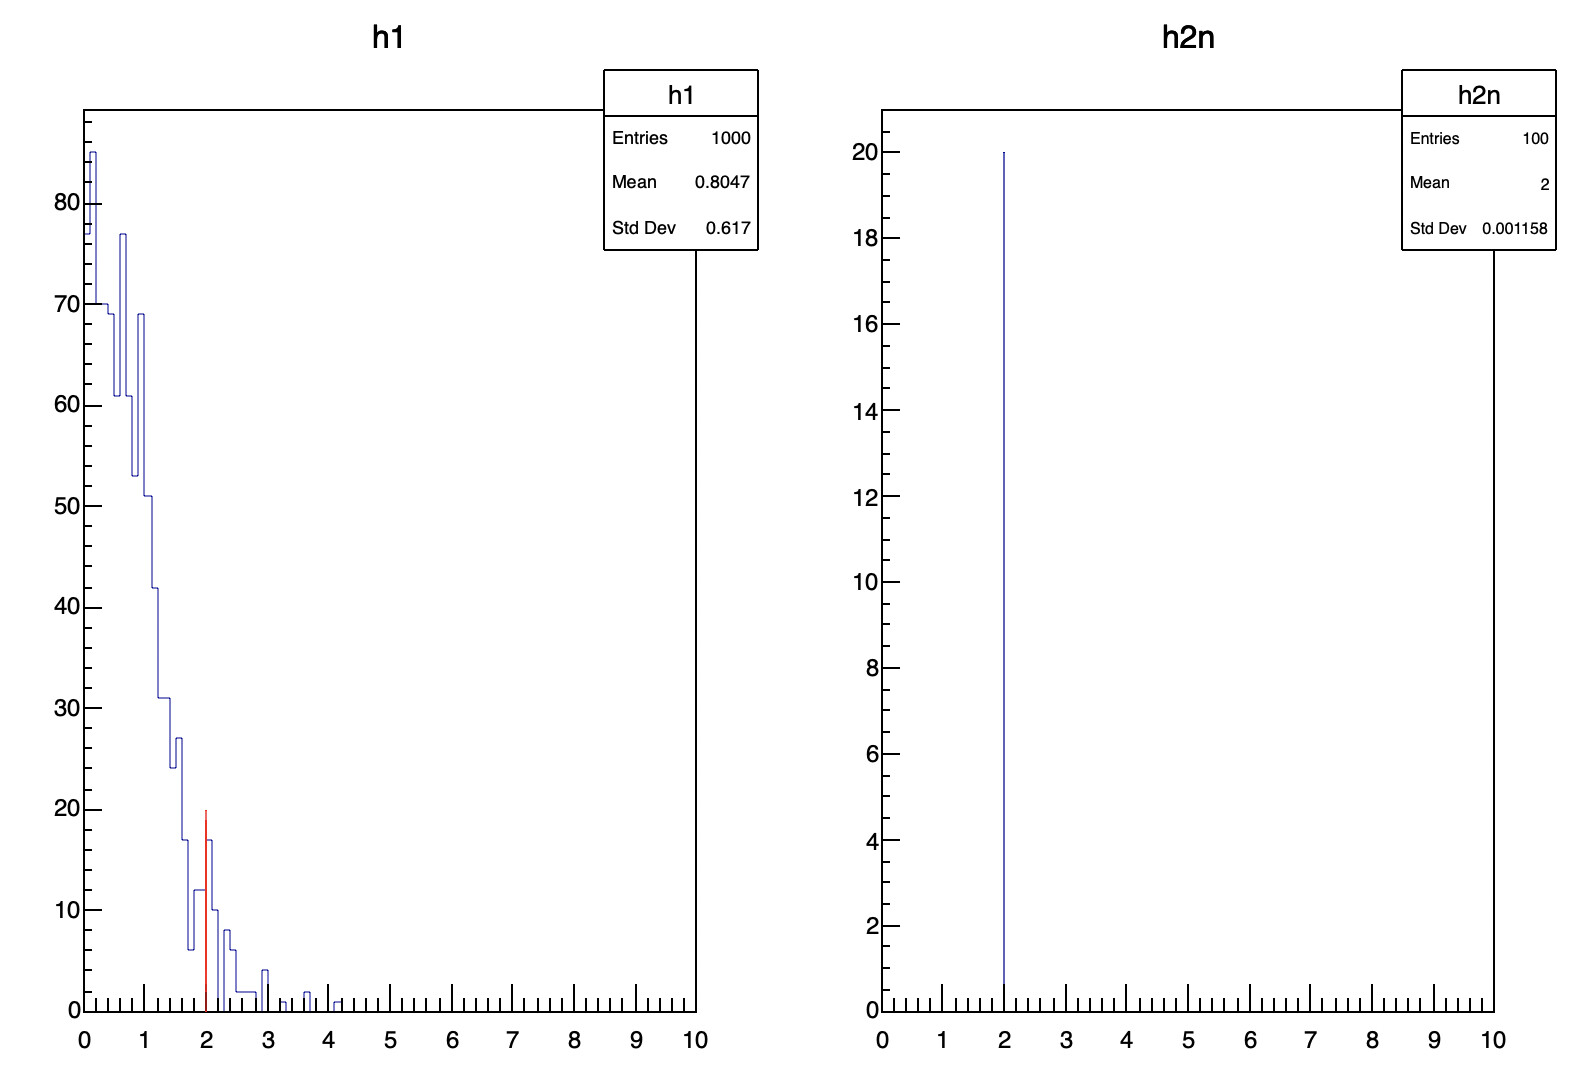
Here is a pyROOT macro that can replicate my problem. What happens is that SetBins(…) changes the bins, but bin “j” has the same entries as it did before.
The expected outcome would be that the small histo would have a very small number (two) of non-zero bins with every other bin having zero entries.
Thank you,
Giorgos
_ROOT Version: 6.12/07
_Platform: linuxx8664gcc
Compiler: Not Provided