For TProfile, the “TEXT” option for draw will display the mean values as TEXT. This is a very nice feature, especially when mean values are written in a 2D grid for a TProfile2D.
I would also like to view the error (or RMS) for each bin in a similar fashion.
Is there a drawing option for TProfile (or histograms) to display the errors as text?
Or else, is there an elegant way to extract the error values and display them like the mean values are displayed using the TEXT option?
EDIT : In the case of profile histograms it is possible to print the number of entries instead of the bin content. It is enough to combine the option “E” (for entries) with the option “TEXT”.
When using a “text” option: Is a setter for the text content above particular bin available (I couldn’t find it quickly in documentation) or the text content above particular bin is always hardwired to be the value of a particular bin content?
For a 1D profile I am looking for a way to represent on the same plot both the bin content and number of bin entries for each bin. Drawing with option “text” would perfectly serve the purpose if what is written in text would represent the number of bin entries instead of the bin content as it is now done by default.
1.) Does it really hurt to provide a setter for the text content above particular bin?
2.) Any other suggestion how I can elegantly represent on the same plot both the bin content and number of entries for each bin for 1D profile?
You can use the option B in ProjectionX to create a new histogram containing the number of entries per bin. Then you plot this histogram using option TEXT. You can also use option the option SAME if you want to superimpose it on top of the original histogram
Thanks for a quick reply - your proposed solution sounds OK, however it could be that I have still misunderstood something. With following piece of code:
{
 TProfile *p = new TProfile("p","p",2,0,2);
 p->Fill(0.5,1);
 p->Fill(0.5,1);
 p->Fill(1.5,1);
 p->GetXaxis()->SetBinLabel(1,"1st bin");
 p->GetXaxis()->SetBinLabel(2,"2nd bin");
 cout<<"1st bin entries: "<<p->GetBinEntries(1)<<endl;
 cout<<"2nd bin entries: "<<p->GetBinEntries(2)<<endl;
 TH1D *h = p->ProjectionX("B");
 p->Draw("");
 h->Draw("TEXTSAME");
}
I am getting for the text above first bin 1 instead of 2 that I want to see there in this example. Could you please indicate what I am still missing?
Thanks and cheers,
Ante
P.S. ROOT 5.26/00b (tags/v5-26-00b@32327, Apr 12 2010, 16:36:00 on linux)
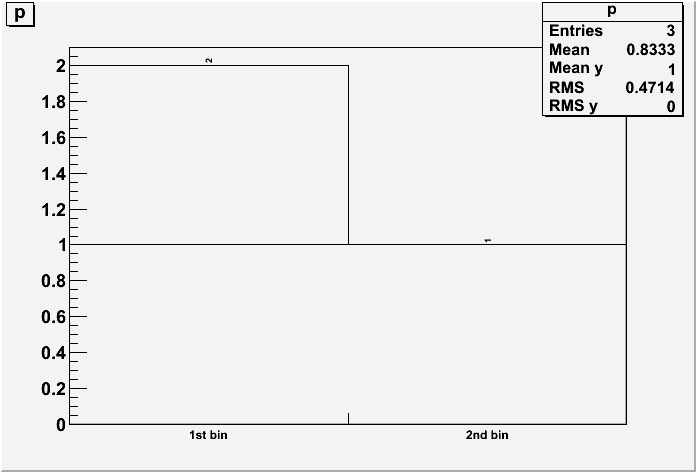
By taking into account your comment and in order to get rid of the error bars I have in addition modify:
h->Draw("HISTTEXTSAME");
Attached is the resulting plot - however this is not what I need. The contents of both bins are 1, only bin entries are different. In the resulting superimposed plot also the bin contents appear different.
Yes, when you do that the number of entries is plotted at the a Y position equal to the number of entries, not at the histogram content. To do what you are asking a new option is needed. TEXTE for instance.
To draw the errors just add the option “E” to the option TEXT. It should be make more clear here root.cern.ch/root/html/THistPainter.html#HP15 and also it invalidate the name “TEXTE” for the new option for the profiles.