How to prevent TPolyLine appearing outside of the Histogram? Some dots which define TPolyLine are outside of the 2DHistograms dimensions so it is shown on all available Canvas area , but I only want that part of the colored TPolyLine which is inside of the 2DHistogram to be shown.
Hello @jonas
Thank you for your answer.
This is part of code concerning plot of PolyLine:
TGraph *min = new TGraph();
min->SetPoint(0,truth_PVx,truth_PVy);
min->SetMarkerStyle(29);
min->SetMarkerColor(kRed);
min->Draw("Psame");
Double_t dx = 0.2; Double_t dy = 0.2;
Int_t ncolors = gStyle->GetNumberOfColors();
Double_t x[4],y[4];
float phi = jet_phi_orig->at(index_max_truthpt);
cout<<"Jet truth phi orig: "<<phi<<endl;
x[0] = truth_PVx; y[0] = truth_PVy;
x[1] = x[0] + 500.*cos(phi+0.4); y[1] = y[0] + 500.*sin(phi+0.4);
x[2] = x[0] + 500.*cos(phi-0.4); y[2] = y[0] + 500.*sin(phi-0.4);
x[3] = x[0]; y[3] = y[0];
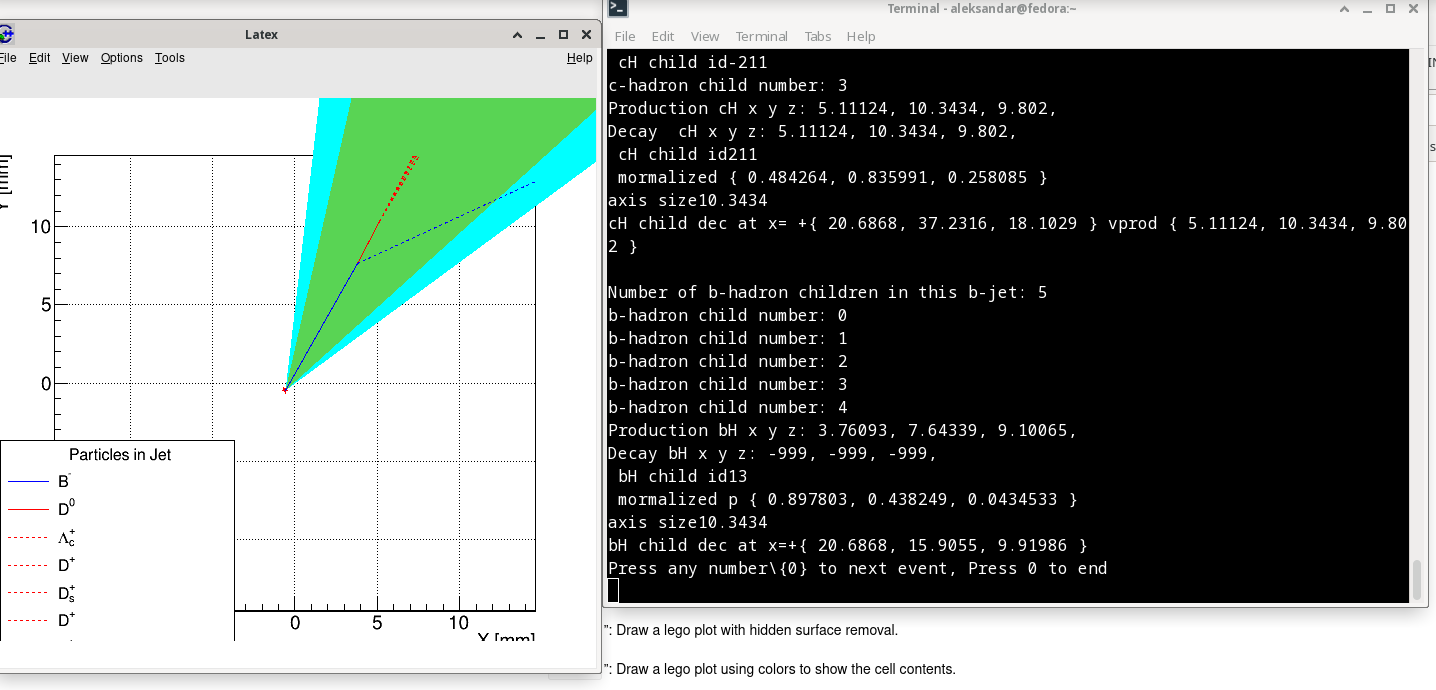
TPolyLine *pl = new TPolyLine(4,x,y);
pl->SetFillColorAlpha(7, 0.571);
pl->Draw("f");
x[0] = truth_PVx; y[0] = truth_PVy;
x[1] = x[0] + 50.*cos(phi+0.3); y[1] = y[0] + 50.*sin(phi+0.3);
x[2] = x[0] + 50.*cos(phi-0.3); y[2] = y[0] + 50.*sin(phi-0.3);
x[3] = x[0]; y[3] = y[0];
TPolyLine *pl_bH = new TPolyLine(4,x,y);
pl_bH->SetFillColorAlpha(8, 0.571);
pl_bH->Draw("f");
And declaration of histogram and canvas:
#include "TFile.h"
#include "TTree.h"
#include "TH2D.h"
#include "TH1D.h"
#include "TSystem.h"
#include "TCanvas.h"

#include <string>
#include <vector>
#include <iostream>
#include <iomanip>

using namespace ROOT::VecOps;

//Canvas for lines:
TCanvas *c1 = new TCanvas("c1","Latex",10,53,604,594);

 TH2D *display__1 = new TH2D("display__1","b-hadron display",1000,-100,100,1000,-100,100);
All values like truth_PV are taken from date file. I am sorry that I do not have permit to post whole macro.
Can you post a running macro?
That does not help. Send a running example.