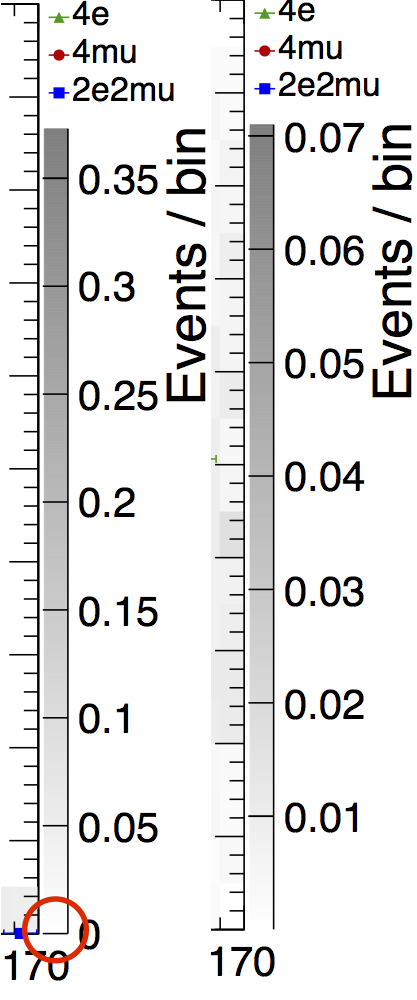
I have a bunch of 2D plots and in some of them palette appears OK i.e. with the horizontal line at the bottom of the palette, as shown in the red circle on the left plot. Right plot is problematic because for some reason the palette doesn’t have bottom horizontal line. I used the same function to produce the plots, only different variable. Any ideas?
No, it is not a bug.
Your Z-axis histogram (the one drawn on the palette) goes from the minimum on Z to the maximum on Z. The lines you see are the ticks marks of this axis. The axis labels are optimized by default. If the minimum of the histogram does not correspond to a label then there is no tick mark at the bottom.