ok, maybe I explained myself wrong, but luckily I found another answer from you with what I meant 
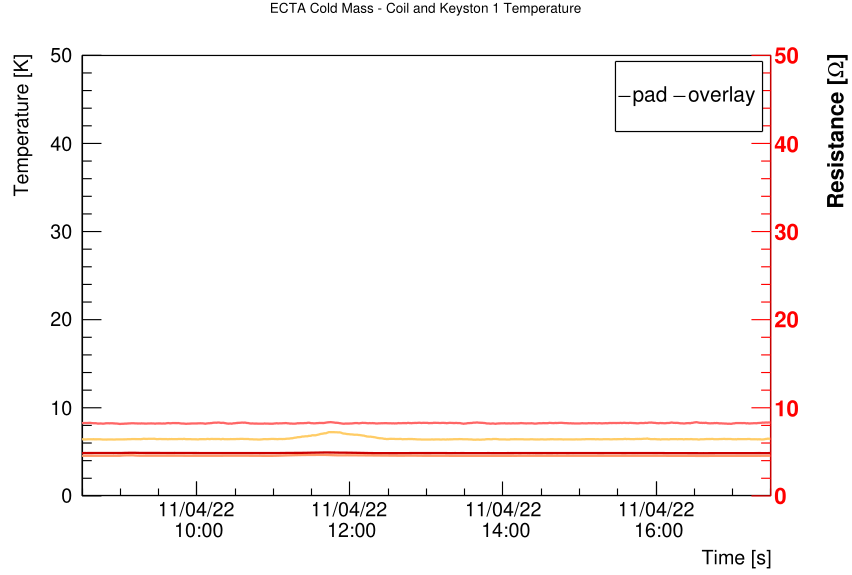
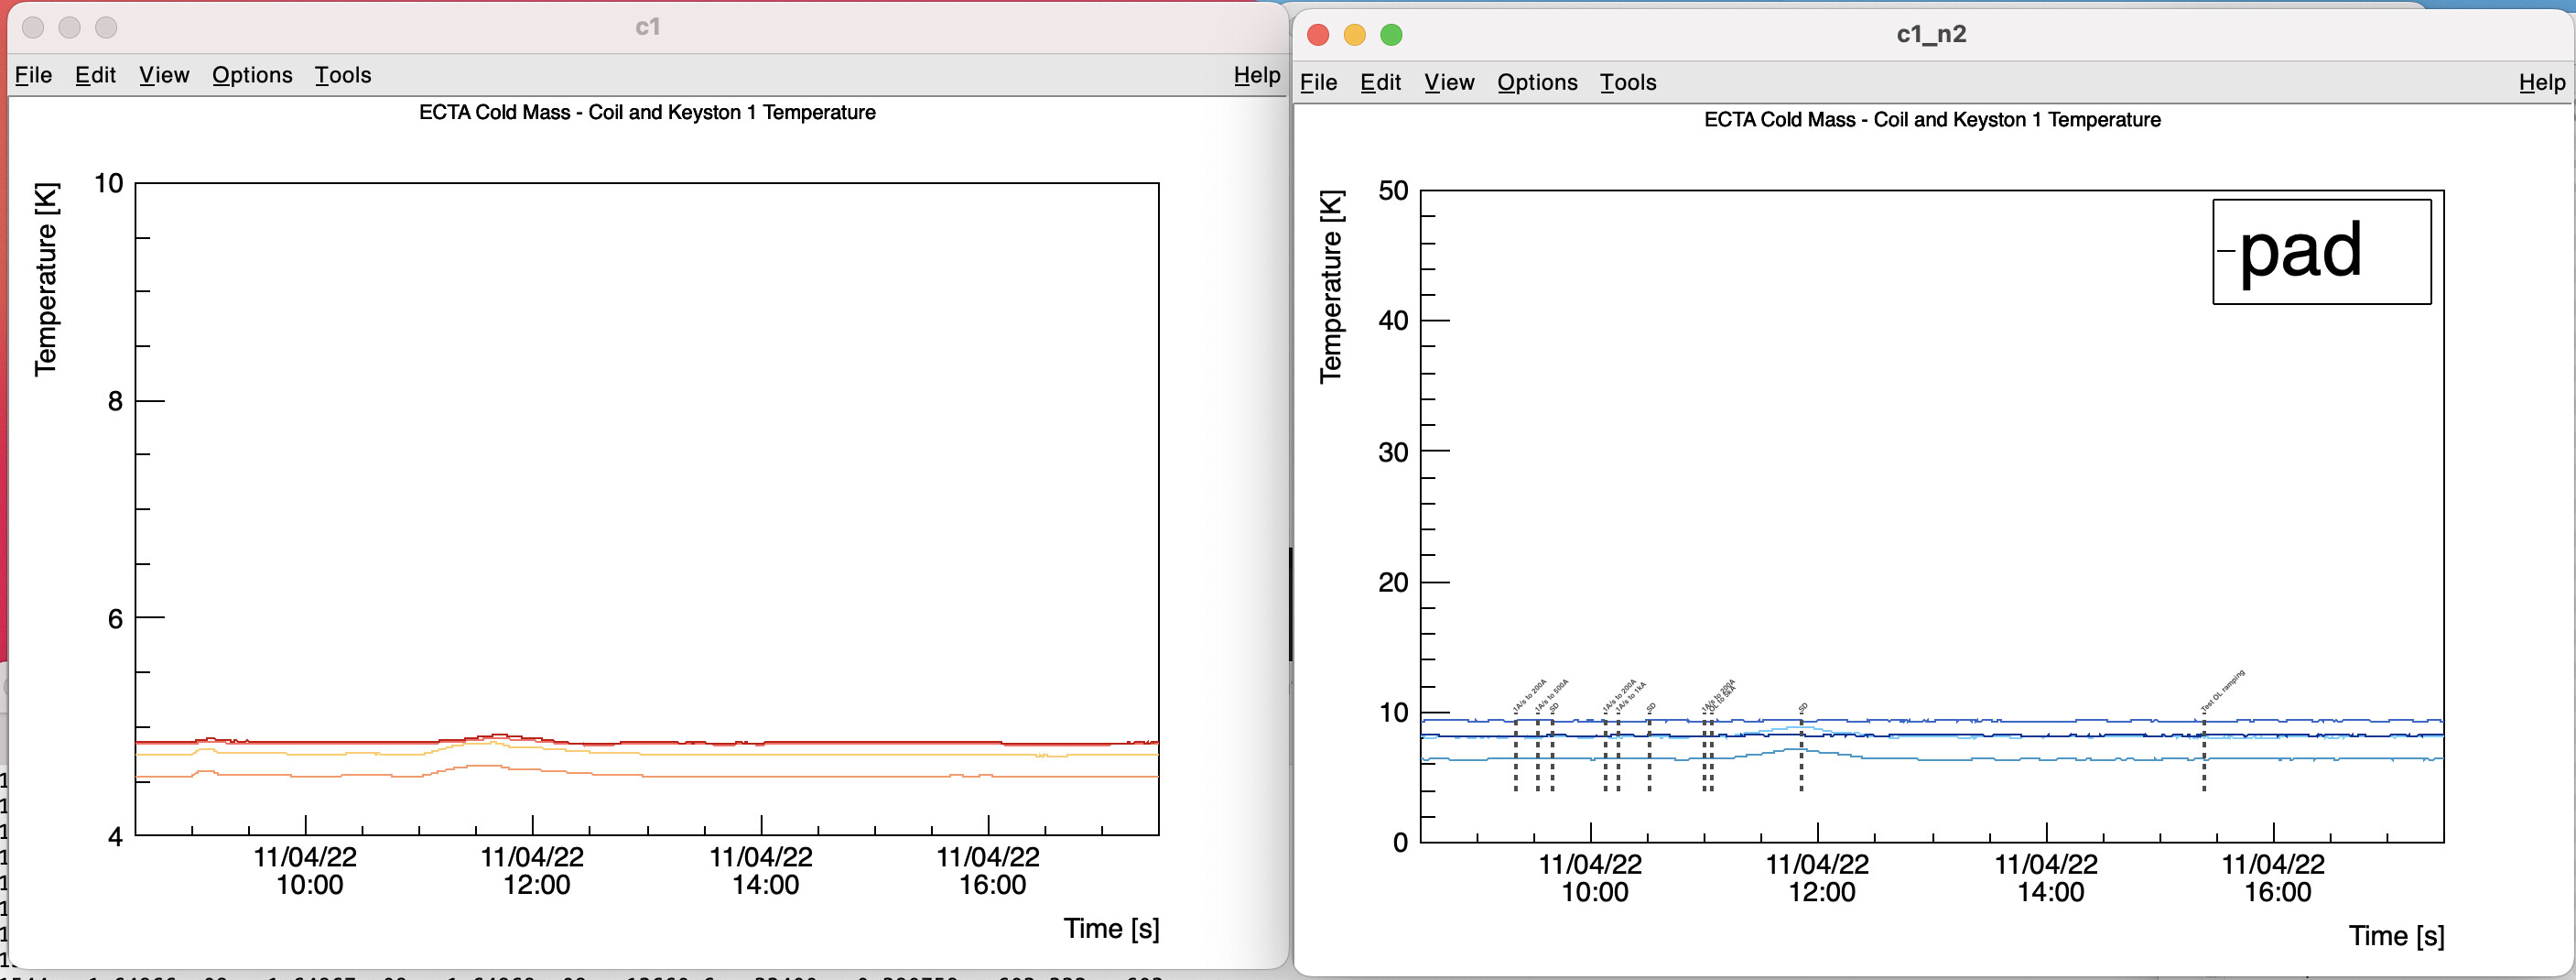
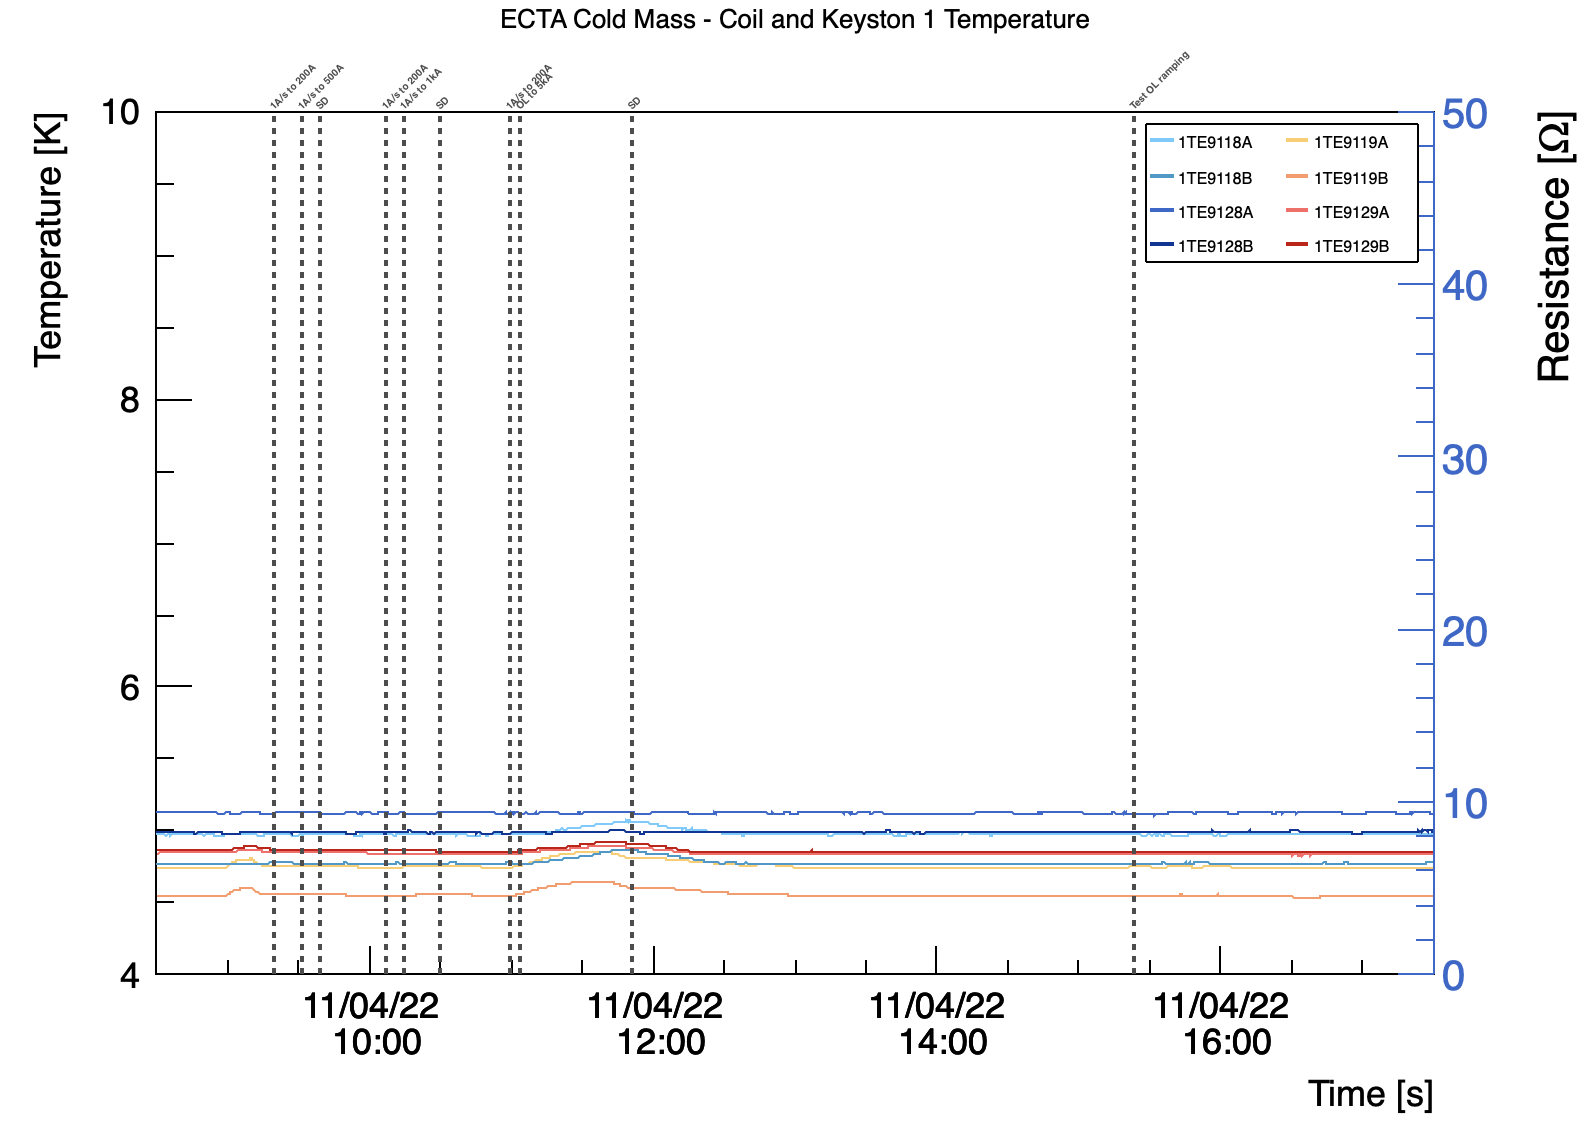
I’m almost there now, but the blue axes does not want to go to the right:
#include <iostream>
#include <map>
#include <vector>
#include <fstream>
#include "TCanvas.h"
#include "TPad.h"
#include "TGraph.h"
#include "TMultiGraph.h"
#include "TTree.h"
#include "TList.h"
#include "TDatime.h"
#include "TAxis.h"
#include "TGaxis.h"
#include "TLegend.h"
#include "TStyle.h"
#include "TMath.h"
#include "TLine.h"
#include "TText.h"
// Colors
const int cRed = 632;
const int cOrange = 800;
const int cBlue = 860;
const std::vector<int> cColorsTwelve {cRed-9, cOrange, cBlue+6, cRed-4, cOrange-3, cBlue+5, cRed+1, cOrange+8, cBlue-5, cRed+3, cOrange+4, cBlue-6};
const std::vector<int> cColorsFifteen {cRed-9, cOrange, cBlue+6, cRed-4, cOrange-3, cBlue+5, cRed+1, cOrange+8, cBlue-5, cRed+3, cOrange+4, cBlue-6, cRed+4, cOrange+3, cBlue+3};
const vector<int> cColorsEight {cBlue+6, cOrange-4, cBlue+5, cOrange+6, cBlue-5, cRed-7, cBlue-6, cRed+1};
const vector<int> cColorsFour {cRed-7, cOrange+6, cOrange-4, cBlue+6};
const std::vector<int> cColorsTwo {cOrange-4, cBlue+6};
const int cLineThickness = 2;
bool checkFile (const char* fileName)
{
bool fileExists = false;
std::ifstream file(fileName);
if(file.is_open())
fileExists = true;
return fileExists;
}
TTree* makeTree (const char* pFileName, const char* pSaveFileName)
{
TTree* myTree = new TTree();
myTree->ReadFile(Form("%s", pFileName), "", ',');
myTree->SetName("t1");
TDatime time;
Int_t dateTime;
char Date[100];
TBranch *intTime = myTree->Branch("dateTime", &dateTime);
myTree->SetBranchAddress("Timestamp (LOCAL_TIME)", &Date[0]);
int tempCount = 0;
for (Long64_t i=0; i<myTree->GetEntries(); i++)
//for (Long64_t i=0; i<200; i++)
{
myTree->GetEntry(i);
// Get the date and make it into a string, cut into pieces
std::string sDate(Date);
time.Set(std::stoi(sDate.substr(0,4)),
std::stoi(sDate.substr(5,2)),
std::stoi(sDate.substr(8,2)),
std::stoi(sDate.substr(11,2)),
std::stoi(sDate.substr(14,2)),
std::stoi(sDate.substr(17,2)));
dateTime = time.Convert();
intTime->Fill();
}
myTree->ResetBranchAddresses(); // Disconnect from local variables
// myTree->Print();
// Save the TTree to a file
myTree->SaveAs(pSaveFileName);
return myTree;
}
TGraph* RunningAverageNormalized(TGraph* inputGraph, const int pWindow, const int pNorm)
{
TGraph* outputGraphtemp = new TGraph();
TGraph* outputGraph = new TGraph();
if (pWindow <= 0 && pNorm <= 0)
return inputGraph;
for (int i=0; i<inputGraph->GetN()-pWindow; i++)
{
double averageX = 0;
double averageY = 0;
for (int j=0; j<pWindow; j++)
{
averageX += inputGraph->GetPointX(i+j);
averageY += inputGraph->GetPointY(i+j);
}
outputGraphtemp->SetPoint(i,averageX/pWindow, averageY/pWindow);
}
if (pNorm > 0)
{
double cNorm = 0.0;
for(int i=0; i<25; i++)
cNorm += outputGraphtemp->GetPointY(i);
cNorm = cNorm/25;
for(int i=0; i<outputGraphtemp->GetN(); i++)
outputGraph->SetPoint(i, outputGraphtemp->GetPointX(i), outputGraphtemp->GetPointY(i)-cNorm);
// outputGraph->SetPoint(i, outputGraphtemp->GetPointX(i), outputGraphtemp->GetPointY(i)-cNorm+pNorm);
}
else
outputGraph = outputGraphtemp;
return outputGraph;
}
void doubleYAxis (double unit, int normalize, int nColumns, bool temperature,
std::vector<TTree*> pTree,
std::vector<const char*> pSensorList,
std::vector<const char*> pLegends,
const char* pTitles,
const char* pSaveFileName,
const vector<int> cColors,
TDatime pStart, TDatime pStop,
const double yLow, const double yHigh, const double yLow1, const double yHigh1, const double pWindow,
std::vector<int> pLines, std::vector<const char*> pLineTitles, bool IVcurve = false, bool bbGraphs = false, bool doubleLegendX = false, bool doubleLegendY = false)
{
// Make a nice legend for whatever number of entries
double cLegendSizeY = cColors.size()/nColumns;
double cLegendSizeX = nColumns;
if (doubleLegendX)
cLegendSizeX = nColumns*1.7;
if (doubleLegendY)
cLegendSizeY = nColumns;
double lX1 = 0.89, lX0 = lX1-0.085*cLegendSizeX, lY1 = 0.89, lY0 = lY1-0.03*cLegendSizeY;
TLegend* l0 = new TLegend(lX0, lY0, lX1, lY1);
Float_t symbolMargin = 0.02*cLegendSizeX / (lX1 - lX0);
l0->SetMargin(symbolMargin);
l0->SetNColumns(nColumns);
// Make a nice multigraph with the correct titles
TMultiGraph *mg = new TMultiGraph();
TMultiGraph *mg1 = new TMultiGraph();
mg->SetTitle(pTitles);
// mg1->SetTitle(pTitles);
int count = 0;
TCanvas* c1 = new TCanvas();
for ( auto it : pSensorList )
{
c1->Clear();
if (it == std::string("NULL"))
{
std::cout <<"\x1b[31mSensor not found:" << it << "\e[0m" << std::endl;
Double_t x[1] = {double(pStart.Convert())};
Double_t y[1] = {-99.00};
TGraph *myNullHist = new TGraph(1, x, y);
mg->Add(myNullHist, ""); myNullHist->SetTitle(" "); myNullHist->SetLineColor(0);
++count;
continue;
}
TTree* myTree = NULL;
for ( auto jt : pTree )
if (jt->GetBranch(it) != 0) myTree = jt;
// Check if sensor exists in any tree
if (myTree == NULL)
{
std::cout <<"\x1b[31mSensor not found in tree:" << it << "\e[0m" << std::endl;
Double_t x[1] = {double(pStart.Convert())};
Double_t y[1] = {-99.00};
TGraph *myNullHist = new TGraph(1, x, y);
mg->Add(myNullHist, ""); myNullHist->SetTitle(" "); myNullHist->SetLineColor(0);
++count;
continue;
}
// Draw the data for the selected sensor
if (temperature)
myTree->Draw(Form("%s*%f:dateTime", it, unit), Form("dateTime>=%d&&dateTime<=%d&&%s>0", pStart.Convert()-3600, pStop.Convert()+3600, it));
// Access the graphs
TGraph *myHistTemp = (TGraph*)gPad->GetPrimitive("Graph")->Clone();
TGraph* myHist = RunningAverageNormalized(myHistTemp, pWindow, normalize);
if (count % 2 == 0)
mg1->Add(myHist, "Y+L");
else
mg->Add(myHist, "L");
myHist->SetTitle(pLegends.operator[](count));
myHist->SetLineColor(cColors.operator[](count));
myHist->SetLineWidth(cLineThickness);
l0->AddEntry(myHist, pLegends.operator[](count), "l");
++count;
}
delete c1;
TCanvas *cMult = new TCanvas("cMult", "Temperature of the ECTC", 0, 0, 800, 600);
cMult->SetBottomMargin(0.15);
gStyle->SetTitleFontSize(0.025);
TPad *pad1 = new TPad("pad1", "", 0, 0, 1, 1);
TPad *pad2 = new TPad("pad2", "", 0, 0, 1, 1);
pad2->SetFillStyle(4000); // Makes Pad 2
pad2->SetFrameFillStyle(0); // Transparant
pad2->SetBottomMargin(0.15);
pad1->SetBottomMargin(0.15);
pad1->Draw();
pad1->cd();
mg->GetXaxis()->SetLabelOffset(0.025);
mg->GetXaxis()->SetNdivisions(505);
mg->GetXaxis()->SetTitleOffset(1.9);
mg->GetXaxis()->SetLimits(pStart.Convert(), pStop.Convert());
mg->GetXaxis()->SetTimeDisplay(1);
mg->GetXaxis()->SetTimeFormat("#splitline{%d/%m/%y}{ %H:%M}");
mg->GetXaxis()->SetTimeOffset(0,"local");
mg->SetMinimum(yLow);
mg->SetMaximum(yHigh);
mg->GetYaxis()->SetNdivisions(505);
mg->GetYaxis()->SetLabelOffset(0.01);
mg->GetYaxis()->SetTitleOffset(1.2);
mg->Draw("AL");
Double_t cXMin = pad1->GetUxmin();
Double_t cXMax = pad1->GetUxmax();
TAxis *rightY = mg1->GetYaxis();
rightY->SetRangeUser(yLow1, yHigh1);
rightY->SetDrawOption("Y+");
pad2->Draw();
pad2->cd();
mg1->GetXaxis()->SetLabelOffset(0.025);
mg1->GetXaxis()->SetNdivisions(505);
mg1->GetXaxis()->SetTitleOffset(1.9);
mg1->GetXaxis()->SetLimits(pStart.Convert(), pStop.Convert());
mg1->GetXaxis()->SetTimeDisplay(1);
mg1->GetXaxis()->SetTimeFormat("#splitline{%d/%m/%y}{ %H:%M}");
mg1->GetXaxis()->SetTimeOffset(0,"local");
mg1->GetYaxis()->SetNdivisions(505);
mg1->GetYaxis()->SetLabelOffset(0.01);
mg1->GetYaxis()->SetTitleOffset(1.2);
mg1->Draw("Y+ALY+");
mg1->GetYaxis()->SetAxisColor(cBlue-5);
mg1->GetYaxis()->SetLabelColor(cBlue-5);
mg1->GetYaxis()->SetTitle("Resistance [#Omega]");
mg1->GetYaxis()->SetDrawOption("Y+");
pad2->Update();
// Draw the lines with interesting events
TLine* myLine = new TLine(0.4, 0.4, 1.4, 1.4);
myLine->SetLineWidth(cLineThickness);
myLine->SetLineStyle(2);
myLine->SetLineColor(12);
int countL = 0;
for (auto it : pLines)
{
if (it > 0 && it > pStart.Convert() && it < pStop.Convert())
{
myLine->DrawLine(it, yLow1, it, yHigh1);
auto *myText = new TText(it, yHigh1+0.1, pLineTitles.operator[](countL));
myText->SetTextAngle(45);
myText->SetTextAlign(11);
myText->SetTextSize(0.011);
myText->SetTextColor(12);
myText->Draw();
}
++countL;
}
l0->Draw();
// cMult->Update();
cMult->SaveAs(Form("%s_from_%d-%d-%d_%dh%dm%ds-to_%d-%d-%d_%dh%dm%ds.pdf", pSaveFileName,
pStart.GetYear(), pStart.GetMonth(), pStart.GetDay(), pStart.GetHour(), pStart.GetMinute(), pStart.GetSecond(),
pStop.GetYear(), pStop.GetMonth(), pStop.GetDay(), pStop.GetHour(), pStop.GetMinute(), pStop.GetSecond()));
}
void makePlots (TDatime plotsStart, TDatime plotStop, std::vector<int> lineTimes, std::vector<const char*> lineTitles, bool unZoom, std::vector<TTree*> temperatureTreeVec)
{
bool temperatureYN = true;
double unit = 1.0;
int normalize = -99;
double cWindow = 25;
int nColumns = 3;
double cYLow = 0;
double cYHigh = 300;
// ECTA // ////////////// Cold Mass - Coil and Keystone 1 //////////////
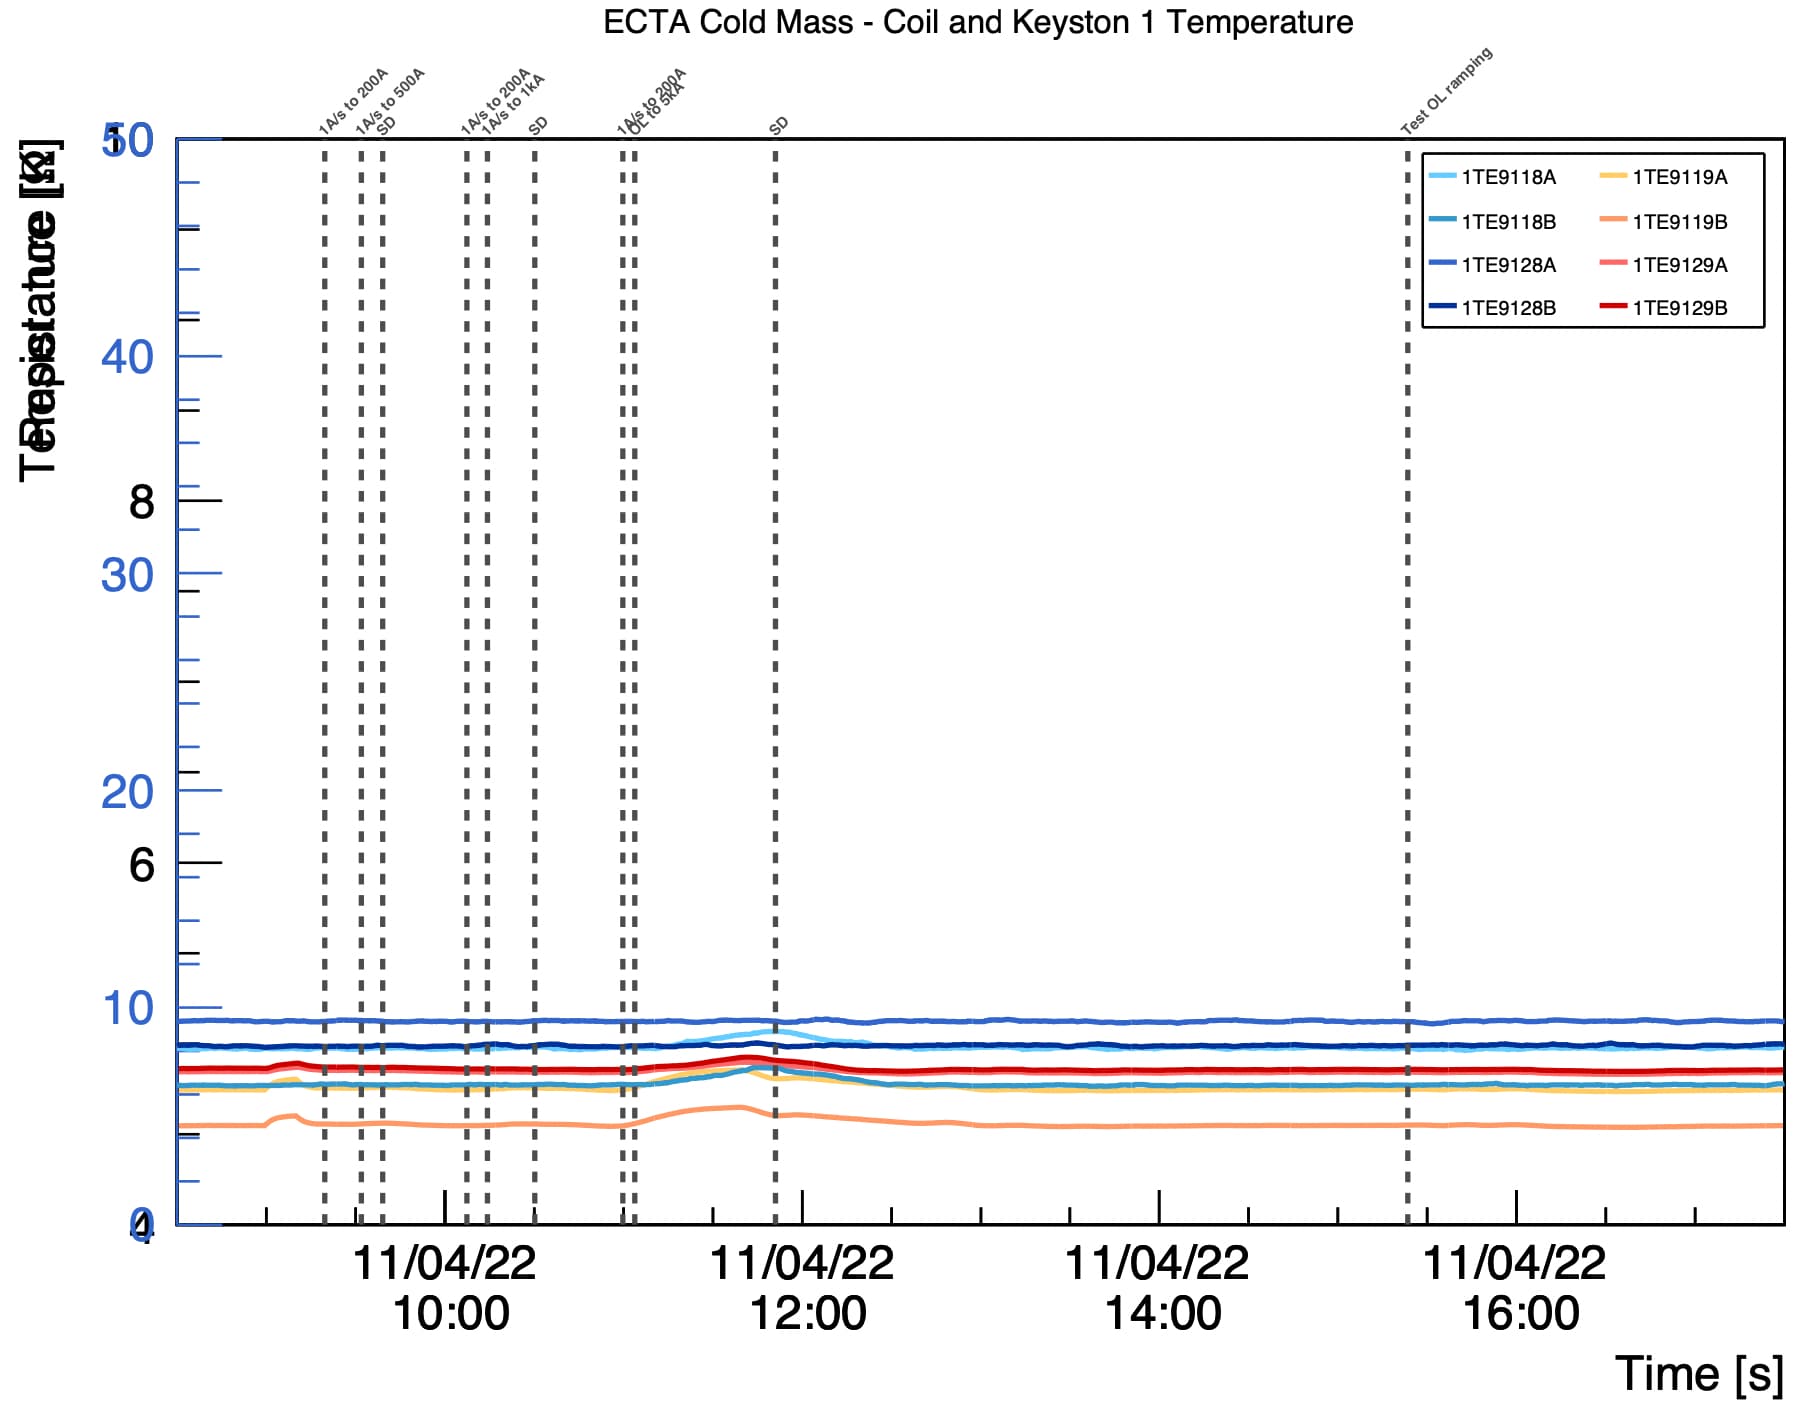
const std::vector<const char*> cECTA1 {"1TE9118A", "1TE9119A",
"1TE9118B", "1TE9119B",
"1TE9128A", "1TE9129A",
"1TE9128B", "1TE9129B"};
const char* cECTA1Titles = "ECTA Cold Mass - Coil and Keyston 1 Temperature;Time [s];Temperature [K]";
const char* cECTA1File = "./ECTA_CM1_Temperature";
cYLow = 4; cYHigh = 10; nColumns = 2; cWindow = 25;
doubleYAxis(unit, normalize, nColumns, temperatureYN, temperatureTreeVec, cECTA1, cECTA1, cECTA1Titles, cECTA1File, cColorsEight, plotsStart, plotStop, cYLow, cYHigh, 0, 50, cWindow, lineTimes, lineTitles, false);
}
void atlasData()
{
// TIMES AND DATES
// Nominal current commissioning day 1
TDatime cNCCDay1Start(2022, 4, 11, 8, 30, 0); // Start NCC Day 1
TDatime cNCCDay1Stop (2022, 4, 11, 17, 30, 0); // Day 1 Finisched
TDatime cNcc1_1(2022, 4, 11, 9, 19, 38);
int ncc1_1 = cNcc1_1.Convert();
TDatime cNcc1_2(2022, 4, 11, 9, 31, 55);
int ncc1_2 = cNcc1_2.Convert();
TDatime cNcc1_3(2022, 4, 11, 9, 39, 5);
int ncc1_3 = cNcc1_3.Convert();
TDatime cNcc1_4(2022, 4, 11, 10, 7, 22);
int ncc1_4 = cNcc1_4.Convert();
TDatime cNcc1_5(2022, 4, 11, 10, 14, 16);
int ncc1_5 = cNcc1_5.Convert();
TDatime cNcc1_6(2022, 4, 11, 10, 30, 10);
int ncc1_6 = cNcc1_6.Convert();
TDatime cNcc1_7(2022, 4, 11, 10, 59, 44);
int ncc1_7 = cNcc1_7.Convert();
TDatime cNcc1_8(2022, 4, 11, 11, 3, 45);
int ncc1_8 = cNcc1_8.Convert();
TDatime cNcc1_9(2022, 4, 11, 11, 51, 00);
int ncc1_9 = cNcc1_9.Convert();
TDatime cNcc1_10(2022, 4, 11, 15, 23, 30);
int ncc1_10 = cNcc1_10.Convert();
// Lines and line titles
std::vector<int> lineTimes {ncc1_1, ncc1_2, ncc1_3, ncc1_4, ncc1_5, ncc1_6, ncc1_7, ncc1_8, ncc1_9, ncc1_10};
std::vector<const char*> lineTitles {"1A/s to 200A", "1A/s to 500A", "SD", "1A/s to 200A", "1A/s to 1kA", "SD", "1A/s to 200A", "OL to 5kA", "SD", "Test OL ramping"};
std::cout << "Making the temperature data trees ... " << std::endl;
std::vector<TTree*> treeVec;
TTree* tempECTASh = makeTree("./ecta_temp_0.csv", "./ectaT0.root"); treeVec.push_back(tempECTASh);
TTree* tempECTAKS = makeTree("./ecta_temp_1_K.csv", "./ectaT1.root"); treeVec.push_back(tempECTAKS); std::cout << "Made tree ECTA ..." << std::endl;
makePlots (cNCCDay1Start, cNCCDay1Stop, lineTimes, lineTitles, false, treeVec);
}
ECTA_CM1_Temperature_from_2022-4-11_8h30m0s-to_2022-4-11_17h30m0s.pdf (68.9 KB)