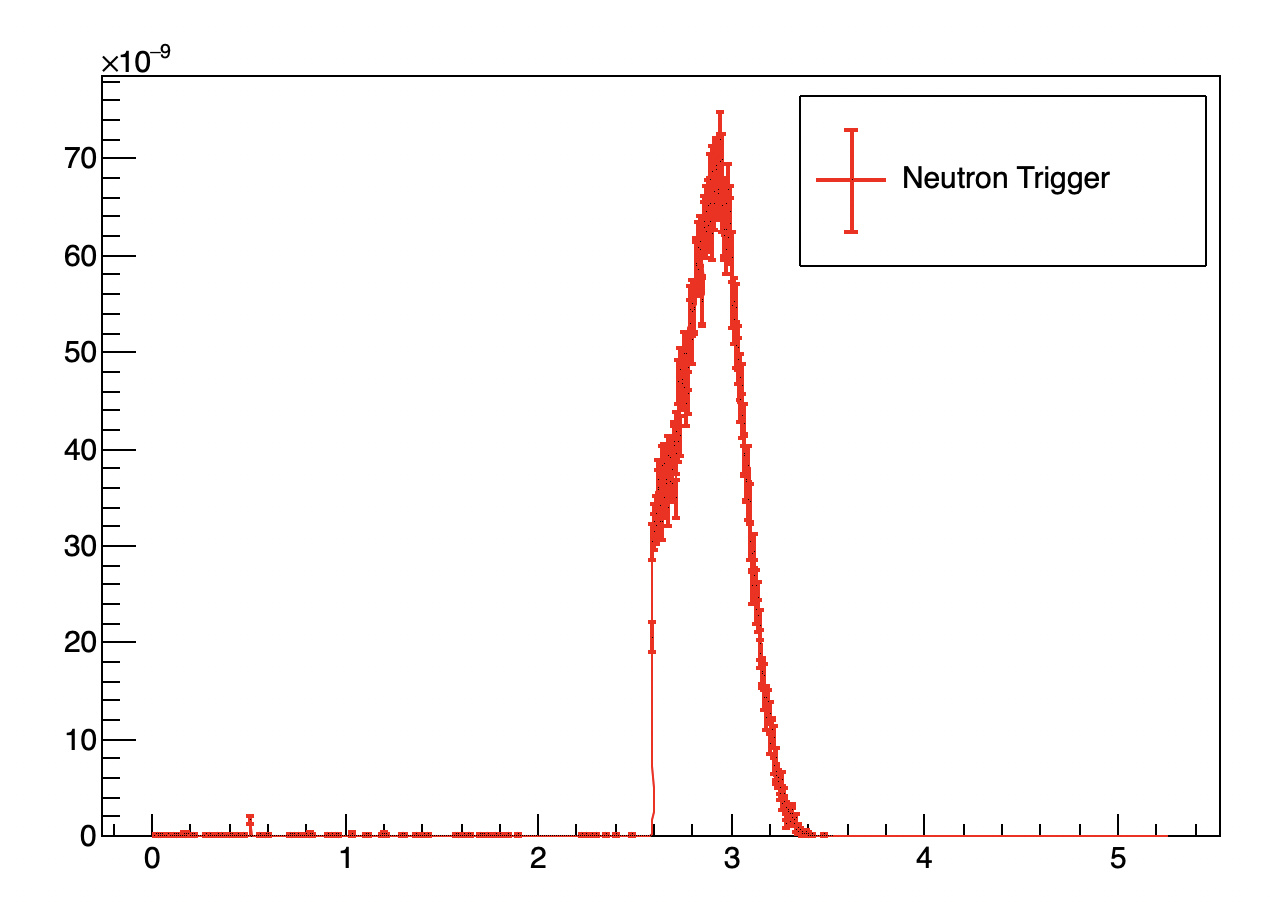
I have a problemi with the TMultigraph() funcition. I have to plot a large number of data in my graphs. The strange things is that when I use the TGraph() the plot are drawn fine without any errors. Instead, when I have to merge together the MultiGraph does not plot all the data.
The range of the data goes from 10^-3 to 5 and it plot only from 10^-3 to 10^-1. If I delete a big portion of data, focussing only on the peak of the function, everything return fine and the plot is drawn normally.
How this can be possible, where is the error?
I tried every solution to modify the range of the axis but with no avail.
Yes, I knew it that I had to replaced the legend but I left this problem for later. The problem was that I obtain this plot usig TGraphError and no with TMultiGraph.
Yes the multigraph needs to know all the graph it contains before drawing it. At drawing time the axis limits are computed in a such way all the graphs are entirely visible. Therefore the final axis are computed at drawing time. That’s why the axis are valid only after drawing.