Hi all,
I’m trying to make a TMultiGraph in PyROOT but I’m having some problems with the Y axis limits.
mgGraphs[z].GetXaxis().SetLimits(minCoef, maxCoef) # minCoef = -5; maxCoef = 5; It works fine
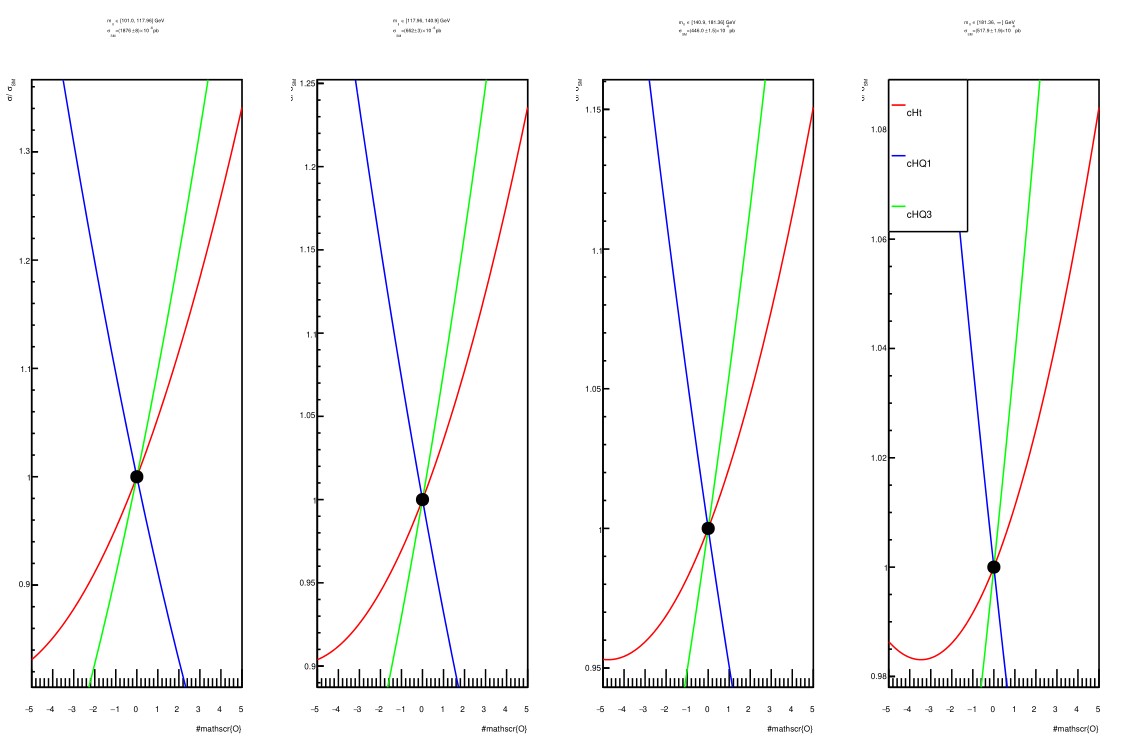
The problem is that all curves are parabolas. The cHQ1 seems a straight line, but it is not, the inflection point is below y=0.98.
If I draw cHQ1 alone (cHQ1 only is also a multigraph):
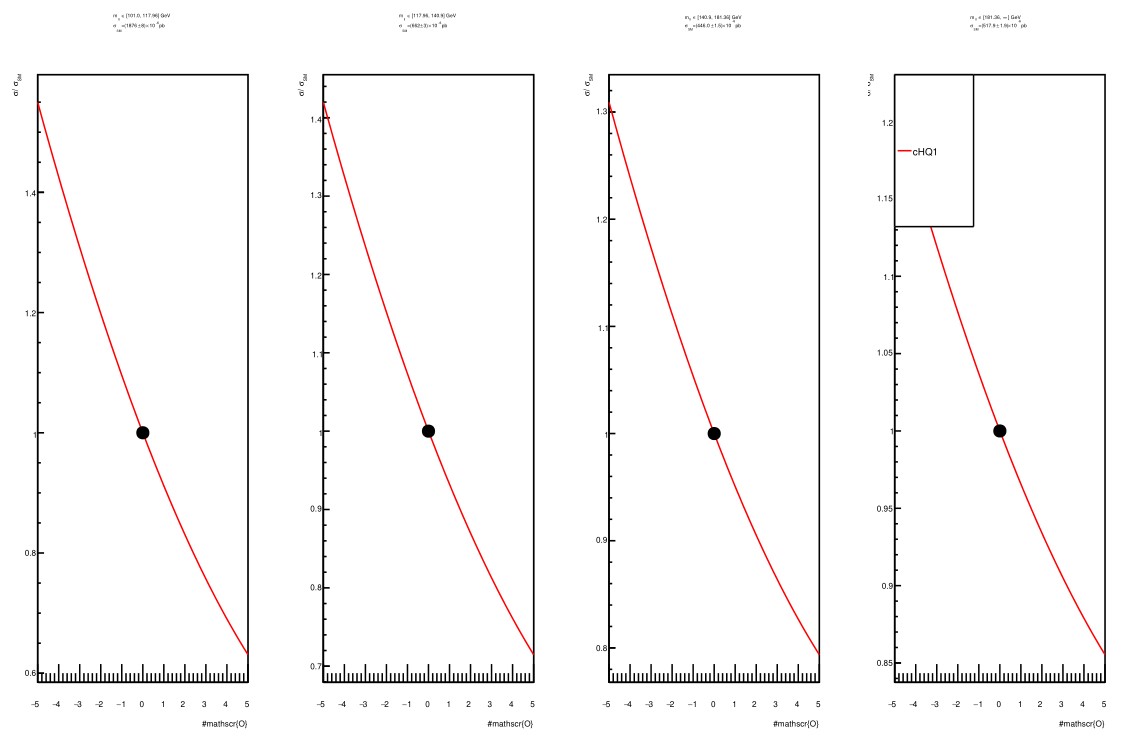
I try to change the Y axis range below y=0.85, but nothing changes.
mgGraphs[z].GetXaxis().SetLimits(minCoef, maxCoef)
mgGraphs[z].GetYaxis().SetLimits(0.5, 2)
First: I need to have same Y axis range in all the multigraphs, it does not matter if there is nothing to plot there
And I try to change Y axis in the multigraph with all curves and I get the same as the first picture. Second: why 0.5 < y < 0.98 are not being shown with mgGraphs[z].GetYaxis().SetLimits(0.5, 2)?
ROOT Version: 6.24/06 (I suppose PyROOT uses the same)
Platform: Windows Subsystem for Linux, Debian
Compiler: IDLE