I am using a TMultigraph to draw several TGraphErrors into one coordinate system:
TMultiGraph *v_r = new TMultiGraph();
v_r->Add(v_r_1);
v_r->Add(v_r_2);
v_r->Add(v_r_3);
v_r->Add(v_r_4);
where the v_r_i are the TGraphErrors, all filled with points.
However, when I draw the TMultigraph using
v_r->Draw("AP");
it is drawn with a competely wrong axis range on the y-axis so that I have to zoom in a lot in order to see anything at all.
Shouldn’t TMultigraph be able to infer the correct axis limits by itself? Or am I doing something wrong?
Ok, here is a shortened version of my script. The TMultigraph is created with only one TGraphErrors. The data for this graph are read from an ascii-file. I attach the macro as well as the data file for testing.
Thanks in advance for any hint towards the problem!
Jens
#include <iostream.h>


void graph_test() {


// open text file
ifstream infile;
infile.open("./velocity_table.txt", ifstream::in);

Int_t numoflines=0;
Float_t radius,velocity,vel_error;

TGraphErrors * v_r_1 = new TGraphErrors();


// read the data from the file and store it in the TGraphErrors:
// first column -> radius
// second column -> velocity
// third column -> vel_error

while(!infile.eof()) {
	numoflines++;

	infile >> radius;
	infile >> velocity;
	infile >> vel_error;


	if (infile.eof()) break;

	v_r_1->Set(numoflines);
	v_r_1->SetPoint(numoflines-1,radius,velocity);
	v_r_1->SetPointError(numoflines-1,0.,vel_error);

}

infile.close();


v_r_1->SetMarkerStyle(kFullCircle);

TMultiGraph *v_r = new TMultiGraph();

v_r->Add(v_r_1);
v_r->Draw("AP");

}
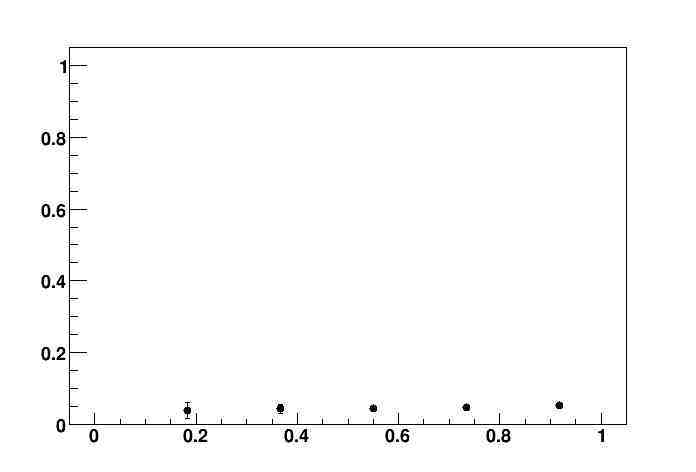
With your macro I get the attached plot which, seems to me, is correct (unless I missed something). Which ROOT version are you using ? on which machine ?
Oh, interesting. I am using ROOT 5.17/05 on an Ubuntu system (installed using the package that was available on the BNL mirror) and there, the result looks as shown below.
Yes… I understand why you are not happy with this result. I’ll try to dig in the ROOT history to find out is there is a bug fix which can explain why we get a good result now.
By the way, if you plot the graph directly, without using a multigraph, do you get the same bad result ?
When I directly plot the graph, everything is fine, it only appears with the TMultigraph. I will just try to upgrade to a newer ROOT version, since it already seems to be fixed there.
I finally managed to compile ROOT 5.19/04. There, the TMultiGraph works perfectly, and I even can zoom into the x-axis when it is set to log-scale (which was actually another problem I experienced with ROOT 5.17)